Skip to content
GatherInsight

Survey platform for research teams

Every data point comes with its proof.

Field, phone, online and voice surveys in one place. Behind every answer sits evidence you can open: who gave it, where and when, what was actually said — and how far to trust it.

Every screenshot on this page is a real screen, showing demo data.

AI check
Quality Review screen: the answer that was entered, compared with what the interview recording says

AI check

Mismatch
Entered by the interviewer
Very satisfied
Heard on the recording
Dissatisfied

“Not very. Honestly, I'm dissatisfied, the connection keeps dropping.”

01 / 03

Are you truly certain your data was actually collected?

A spreadsheet of 1,200 interviews lands in your inbox. Row 847 looks exactly like row 846. Nothing in the file says whether either interview ever took place.

02 / 03

What happens when that data turns out to be wrong or manipulated?

A decision has already been made on it, and the report has already gone out. Back-checks usually reach 5–10% of interviews, weeks later, when the team has moved on and nothing is left to examine but memory.

03 / 03

What if every data point could be proven?

Who answered, where and when, what was actually said, and how far to trust it — attached to every row, while the fieldwork is still running.

See how it works

How it works

Not “trust us”, but proof your research and studies can stand on.

Evidence is captured as part of ordinary fieldwork, not as extra admin afterwards. Every answer carries four kinds of proof.

Interview 847 · Emma Clarke · Very satisfied

  1. Respondent

    R-0847 · from the drawn sample

    Who

    Was this the person we actually sampled?

    The respondent came from the drawn sample, and was interviewed by the person it was assigned to — not by whoever happened to be nearby.

  2. Location & time

    GPS ±9 m · inside the area · 13:49

    Where and when

    Was the interviewer really there?

    A GPS point with accuracy in metres, the start time, the length of the interview, and whether it falls inside the assigned area.

  3. Recording

    11:52 · consent read aloud · 1 mismatch

    What was said

    Is the recorded answer the real answer?

    The conversation is recorded after consent, written out, and compared question by question with what the interviewer typed in.

  4. Trust score

    38 · held for review

    How far to trust it

    Should I rely on this response at all?

    A trust score built from 20 signals, plus a record of who reviewed it and what they decided.

Four ways to collect

Every method has its own fears. And its own proof.

A phone call has no location; an online form has no voice. Below, each method is taken one at a time: what a research buyer worries about, the feature that answers it, and the real screen where that proof lives.

  1. 01

    Field survey

    Face to face, with no supervisor in the room.

    Advanced only

    The fearThe interview never happened, or happened with the wrong person.

    6 features that answer it

    See the proof
  2. 02

    Phone survey

    No face to face — a recording of the conversation instead.

    Basic and Advanced

    The fearThe call was logged but never made, and consent cannot be shown.

    3 features that answer it

    See the proof
  3. 03

    Online link survey

    No interviewer at all. A respondent and a link.

    Basic and Advanced

    The fearA bot, a duplicate, or someone clicking through without reading.

    4 features that answer it

    See the proof
  4. 04

    Voice Survey

    Self-completed, but answered out loud.

    Basic only

    The fearOpen answers flattened into something the respondent never meant.

    4 features that answer it

    See the proof
Method 01 of 4Advanced only

Field survey

Face to face, with no supervisor in the room.

The fearThe interview never happened, or happened with the wrong person.

Method 01 · Field survey

Face to face, with nobody watching. Here is what you can still check.

Field interviews carry the highest risk and the highest cost: the interviewer is alone, the respondent is hard to reach again, and the spreadsheet looks the same either way. GatherInsight attaches evidence to every visit, while the team is still in the field.

Fear → proof

Keep scrolling — the proofs move sideways → Swipe sideways →

01 / 06

The fear

The interview was never actually taken — the form was filled in at home.

The proof

A GPS point on every interview

When the interviewer starts an interview, the app takes a location fix and stores it with the response, together with its accuracy in metres and the time. Every visit becomes a point on the map — including the ones that ended in a refusal.

  • Coloured by visit outcome: completed, refused, not eligible, unreachable
  • Filter by interviewer, review status or AI mismatch
  • Click a point to open that respondent and their answers
Field survey
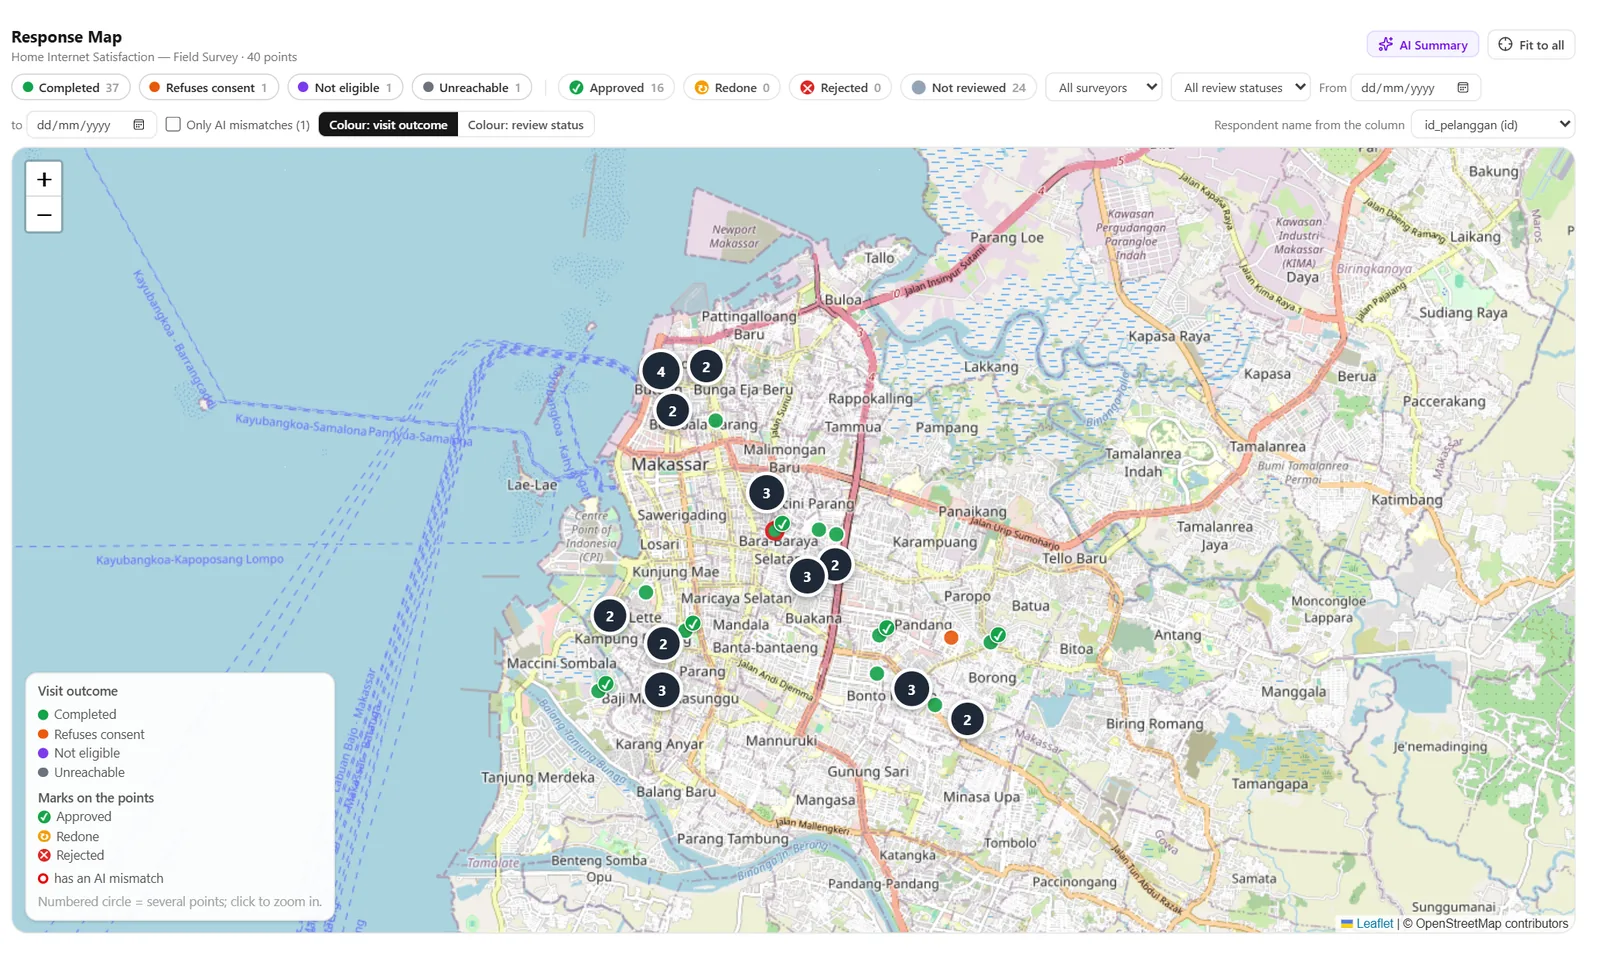
Response Map — 40 demo interviews, coloured by how each visit ended
Response Map — 40 demo interviews, coloured by how each visit endedDemo data

02 / 06

The fear

The interviewer stayed outside the area they were sent to.

The proof

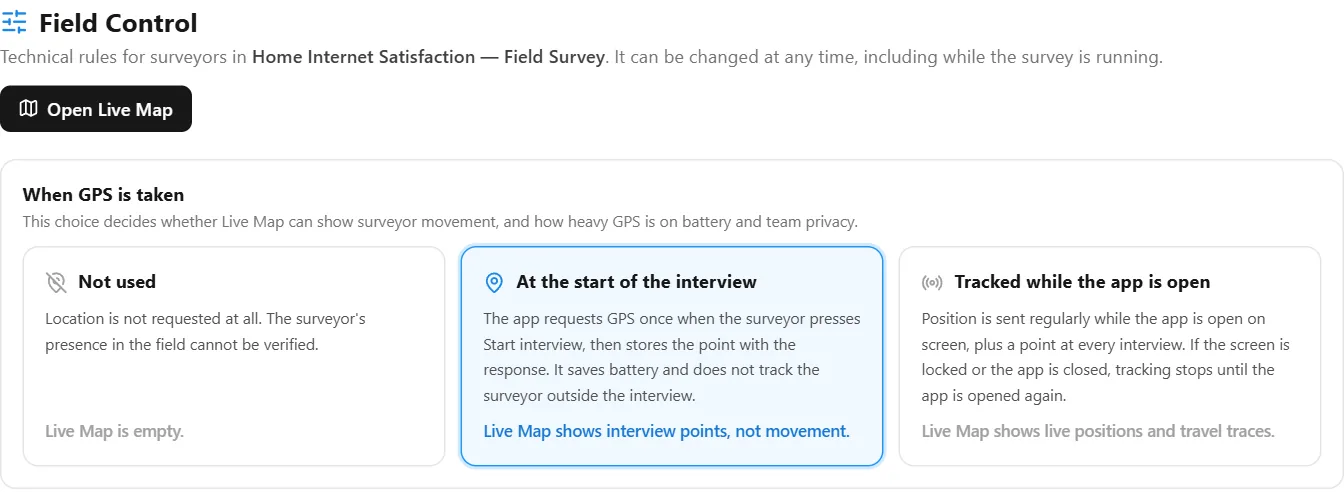
GPS rules you set — and can change mid-fieldwork

Choose whether location is off, taken at the start of each interview, or tracked while the app is open. Draw the assignment area as a radius or polygon, set the accuracy you accept, and reject faked locations.

  • Outside the area: flag the response, or refuse it
  • Faked locations reported by the phone are refused
  • Scheduled pauses, judged against the rule in force at the time
Field survey
Field Control — when GPS is taken, and what the Live Map can show
Field Control — when GPS is taken, and what the Live Map can showDemo data

03 / 06

The fear

Problems surface only after fieldwork has closed.

The proof

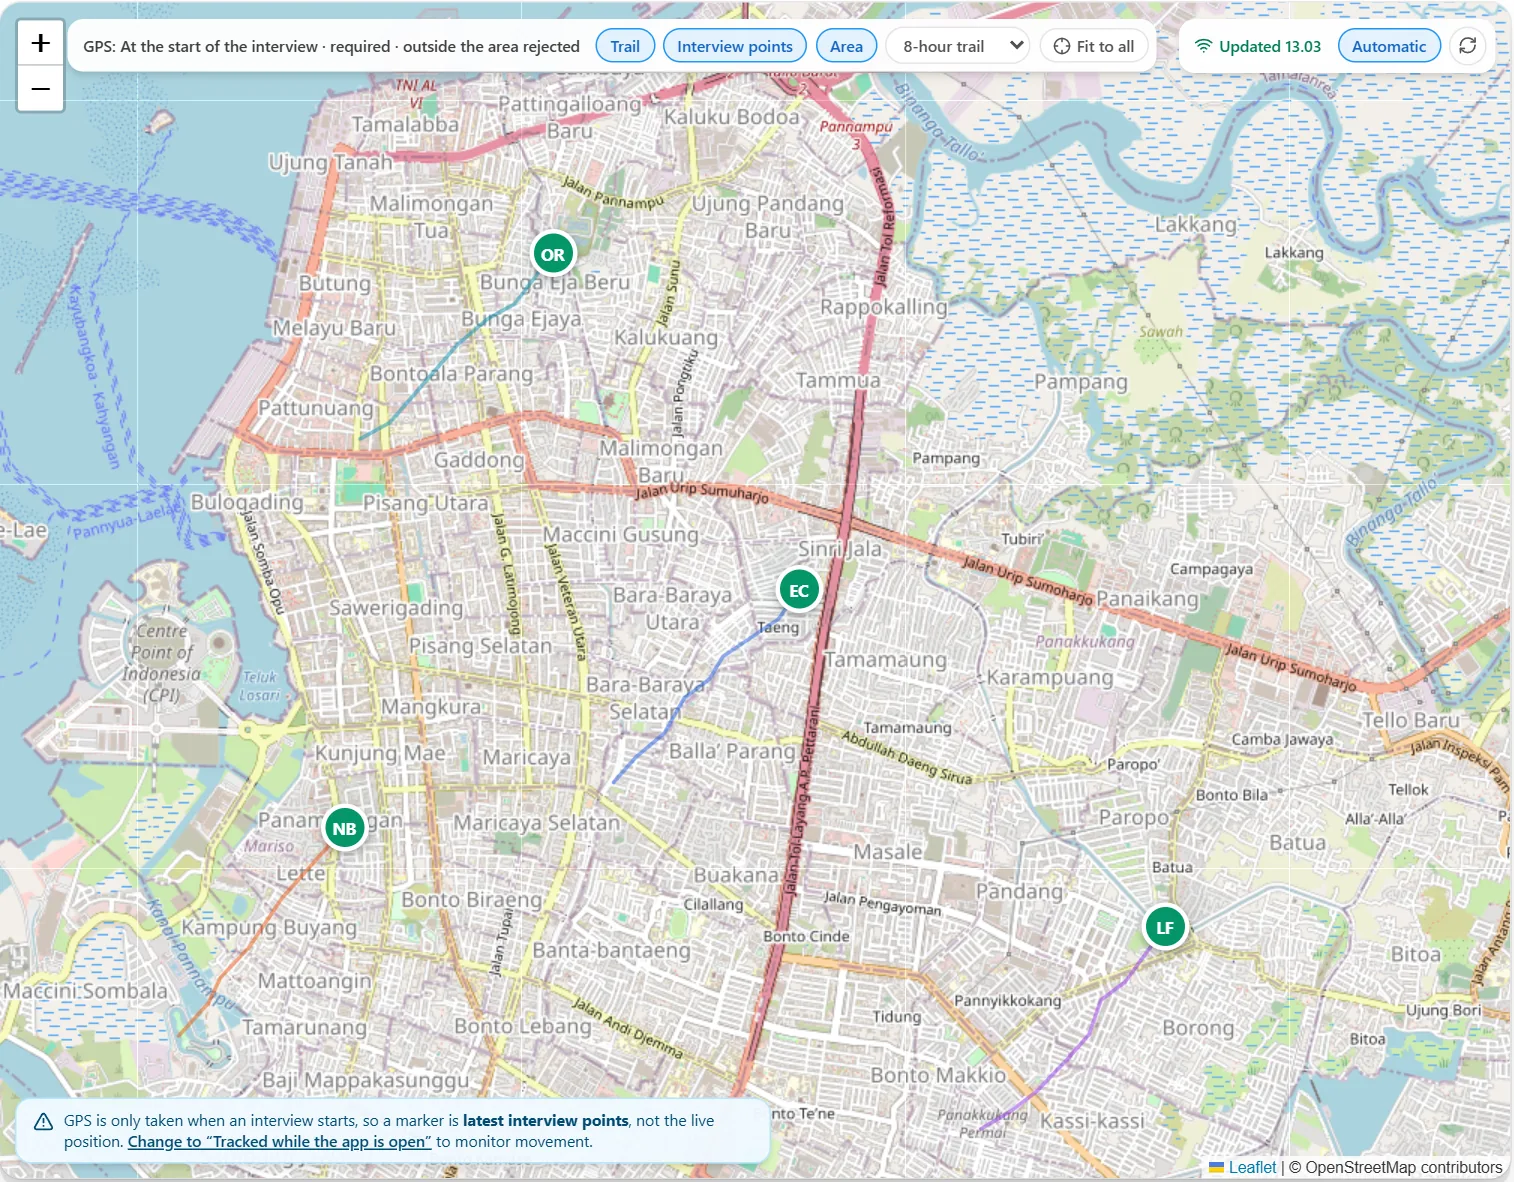
A live map and alerts while the team is still out

See where each interviewer last reported, their trail, and who has gone quiet. Alerts are raised for interviewers who go offline, step outside their area, run low on battery or use a faked location.

  • Active, pending, offline and outside-the-area at a glance
  • An 8-hour trail per interviewer
  • Alerts and messages handled in the same place
Field survey
Live Map — four interviewers, their latest interview points and trails
Live Map — four interviewers, their latest interview points and trailsDemo data

04 / 06

The fear

The easiest person to reach was interviewed, not the one who was sampled.

The proof

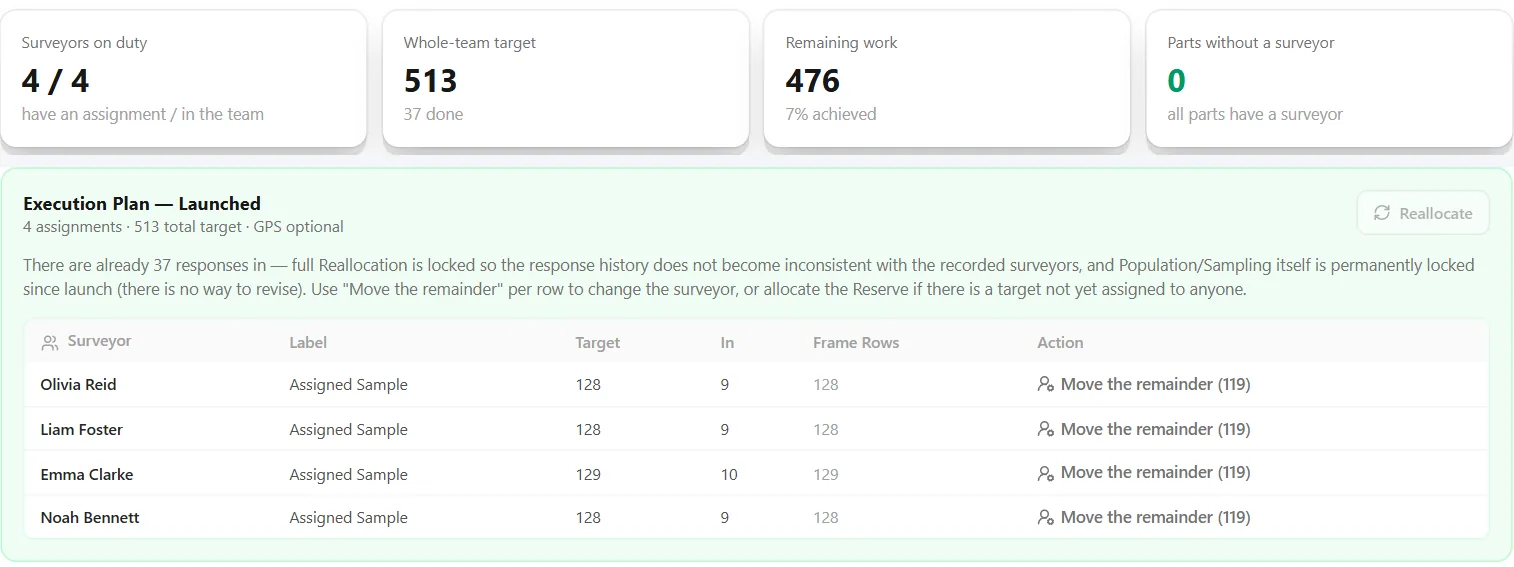
A sample drawn first, then handed out

The sample is drawn from the frame before fieldwork, and each interviewer receives their own list. They cannot pick who to visit, and the office can see how far each one has got.

  • Targets and progress per interviewer
  • Move the remainder when the plan changes, without breaking history
  • Reserves released only when a unit is truly unusable
Field survey
Assignments — who holds which part of the sample, and how much is done
Assignments — who holds which part of the sample, and how much is doneDemo data

05 / 06

The fear

What was typed is not what the respondent said.

The proof

The recording, written out, and checked answer by answer

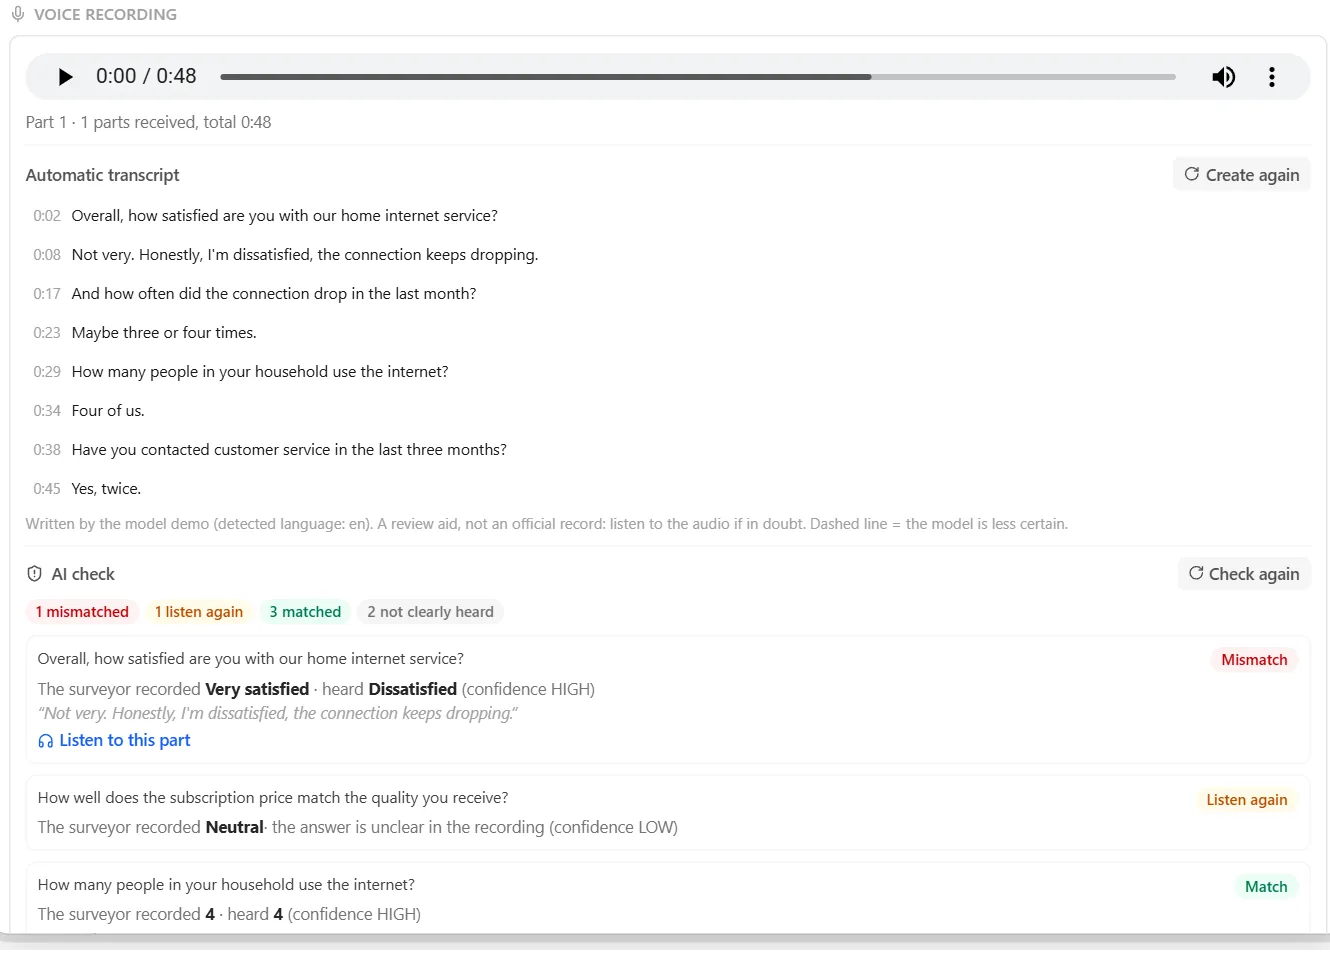
After the respondent agrees, the interview is recorded and transcribed. The AI compares every closed answer with what the recording says and attaches the exact quote. In the demo, the interviewer entered “Very satisfied”; the recording says “dissatisfied”.

  • Match, mismatch, listen again, or not clearly heard
  • One click plays the exact moment of the quote
  • Approve, send back or reject — always a person's decision
Field survey
Quality Review — recording, transcript and the AI check on one interview
Quality Review — recording, transcript and the AI check on one interviewDemo data

06 / 06

The fear

One interviewer quietly cuts corners while the totals look fine.

The proof

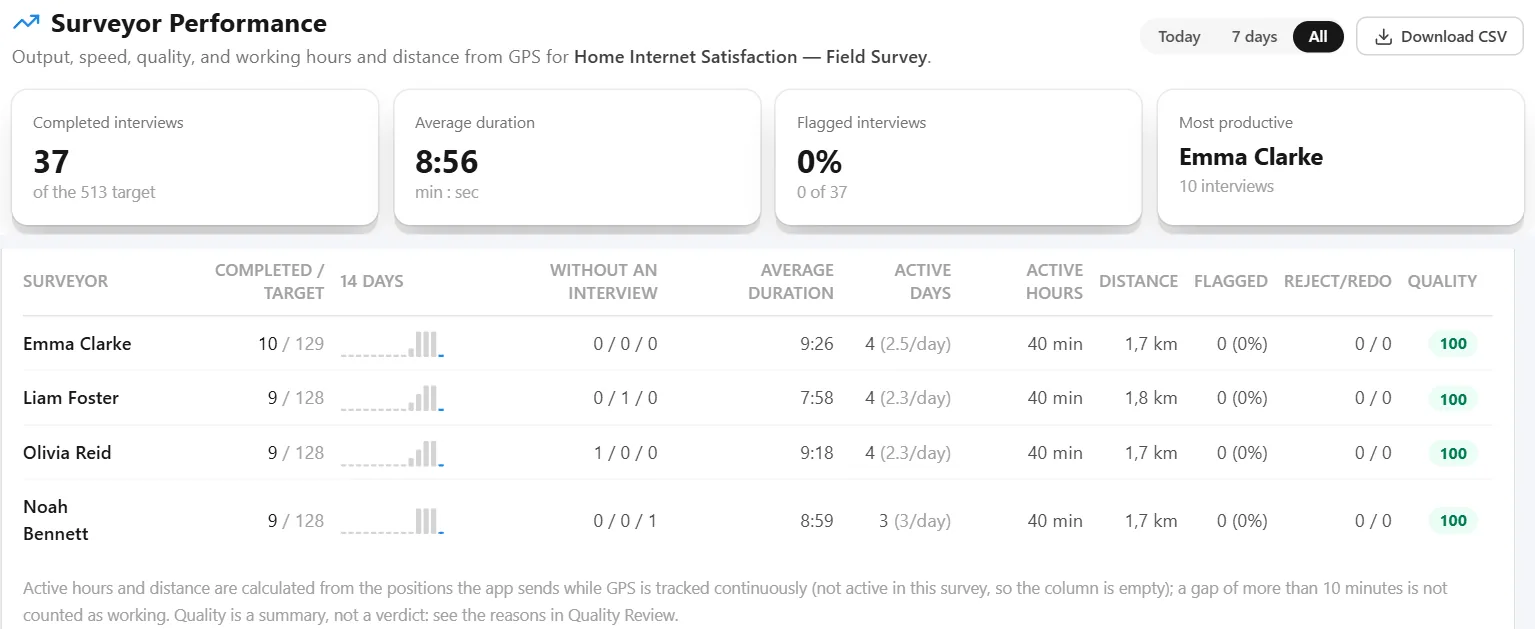
Performance per interviewer, side by side

Output, average duration, visits without an interview, flagged interviews and a quality score per interviewer, in one table. An outlier stands out long before the report is written.

  • Average duration compared across the team
  • Flagged, rejected and redone interviews per person
  • Export to CSV for payment and follow-up
Field survey
Surveyor Performance — output, duration, flags and quality per interviewer
Surveyor Performance — output, duration, flags and quality per interviewerDemo data
Method 02 of 4Basic and Advanced

Phone survey

No face to face — a recording of the conversation instead.

The fearThe call was logged but never made, and consent cannot be shown.

Method 02 · Phone survey

No face to face — so the voice and the consent become the proof.

Phone interviews remove the trip, but not the doubt. Did the call happen? Did the respondent agree? Was the answer written down as it was said? Calls run through WhatsApp Web or a call link from the browser, and every one leaves a trail.

Fear → proof

Keep scrolling — the proofs move sideways → Swipe sideways →

01 / 03

The fear

Calls were logged that never took place.

The proof

Every call runs through the Call Console

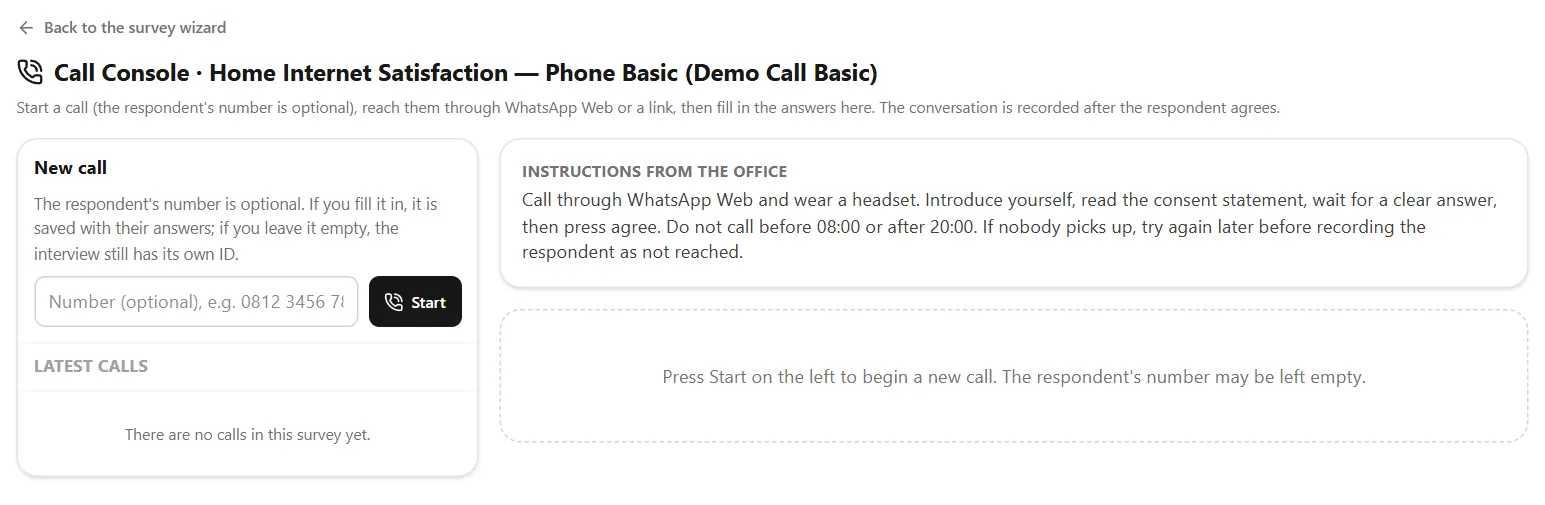
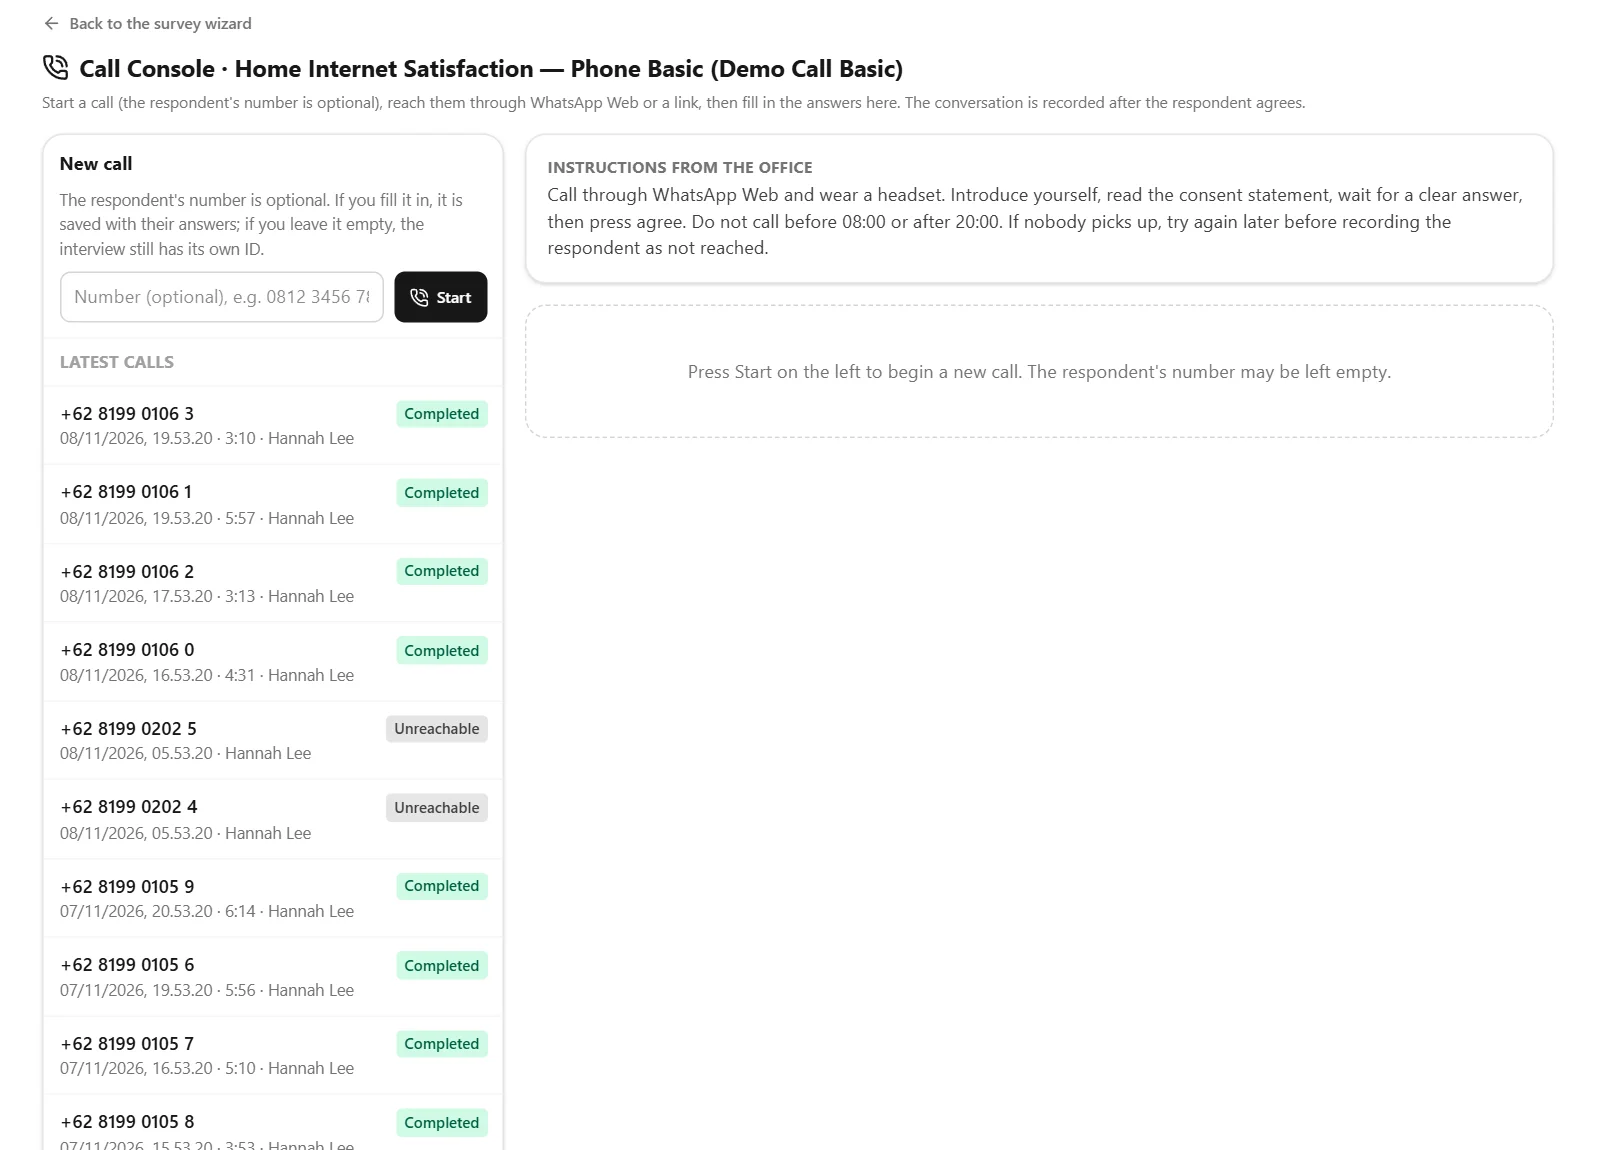
The caller starts each call from the console — through WhatsApp Web or by sending a call link — and fills in the answers while the conversation is recorded. Calls that do not connect are recorded as outcomes, separate from the data.

  • An outcome for every attempt: not reachable, wrong number, declined, completed
  • Who called, when, and for how long
  • A call link needs no app and costs nothing per minute
Phone survey
Call Console — start a call, with the office instructions beside it
Call Console — start a call, with the office instructions beside itDemo data

02 / 03

The fear

Nobody can show the respondent agreed to be recorded.

The proof

Consent read aloud — on the recording itself

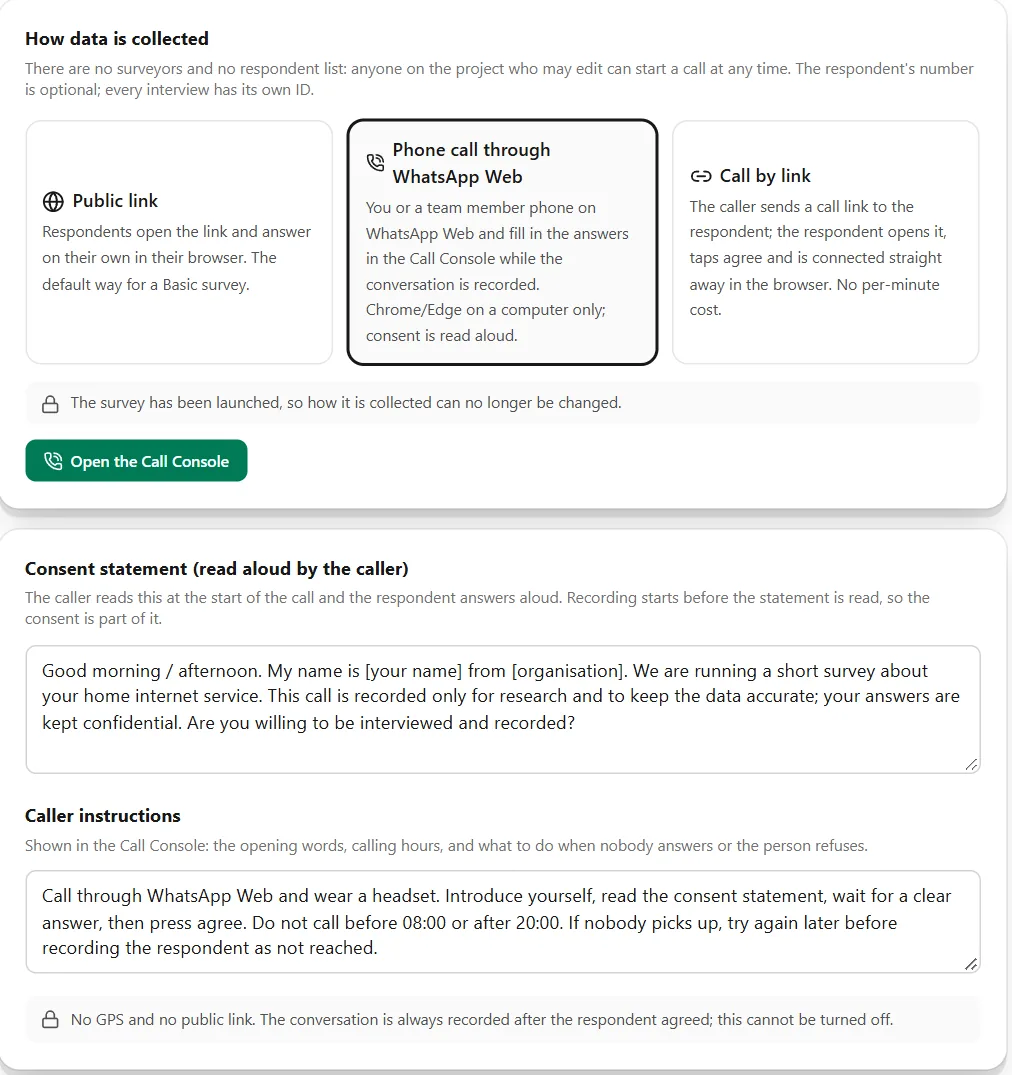
The office writes the consent statement; the caller reads it at the start, and recording begins before it is read, so the agreement is part of the recording. On a call link, the respondent also taps agree on their own screen.

  • Recording after consent cannot be switched off
  • Whoever declines is not recorded
  • Caller instructions and calling hours set by the office
Phone survey
Phone settings — channel, consent statement and caller instructions
Phone settings — channel, consent statement and caller instructionsDemo data

03 / 03

The fear

The answer written down is not the answer given.

The proof

The same answer-by-answer check as in the field

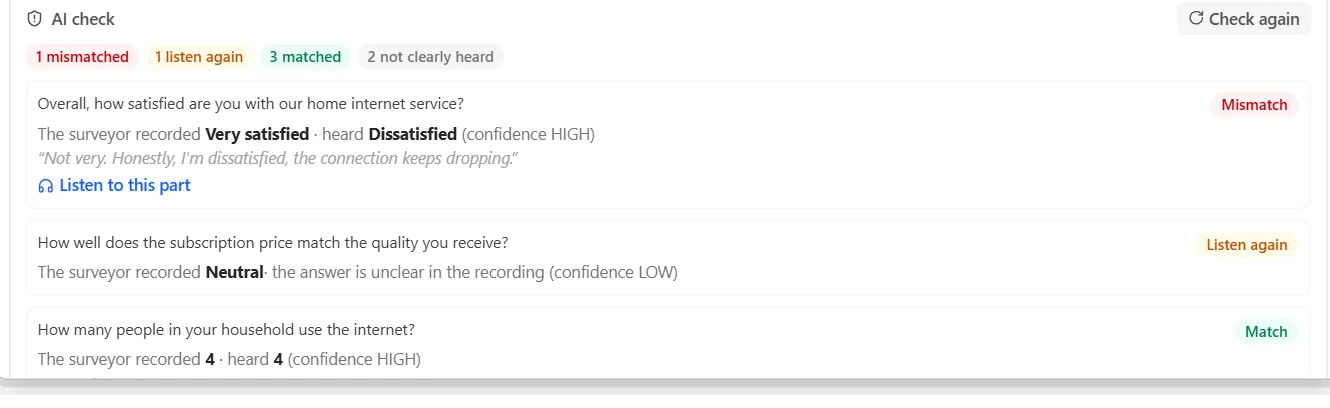
Call recordings are transcribed and checked the same way as field interviews: each closed answer against what was said, with the exact quote. The screenshot comes from a field interview; the check is identical for calls.

  • A mismatch is the card a reviewer opens first
  • Unclear answers are marked “listen again”, never guessed
  • Recordings play from each response, and every playback is logged
Field survey

AI check — one mismatch, one to listen again, three matches
AI check — one mismatch, one to listen again, three matchesDemo data
Method 03 of 4Basic and Advanced

Online link survey
No interviewer at all. A respondent and a link.

The fearA bot, a duplicate, or someone clicking through without reading.

Method 03 · Online link

No interviewer at all. So each response has to speak for itself.

Self-completed surveys bring a different set of fears: bots, duplicates, a link forwarded to the wrong person, and people clicking through without reading. Every response is scored, explained and — if you choose — held back until a person decides.

Fear → proof

Keep scrolling — the proofs move sideways → Swipe sideways →

01 / 04

The fear

A bot or a duplicate slipped in among real respondents.

The proof

A trust score that explains itself

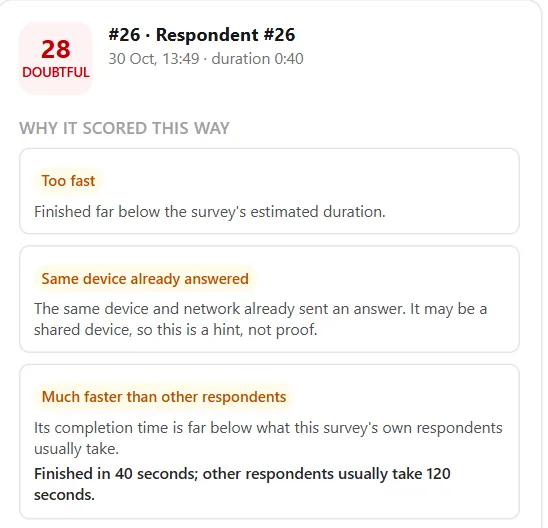
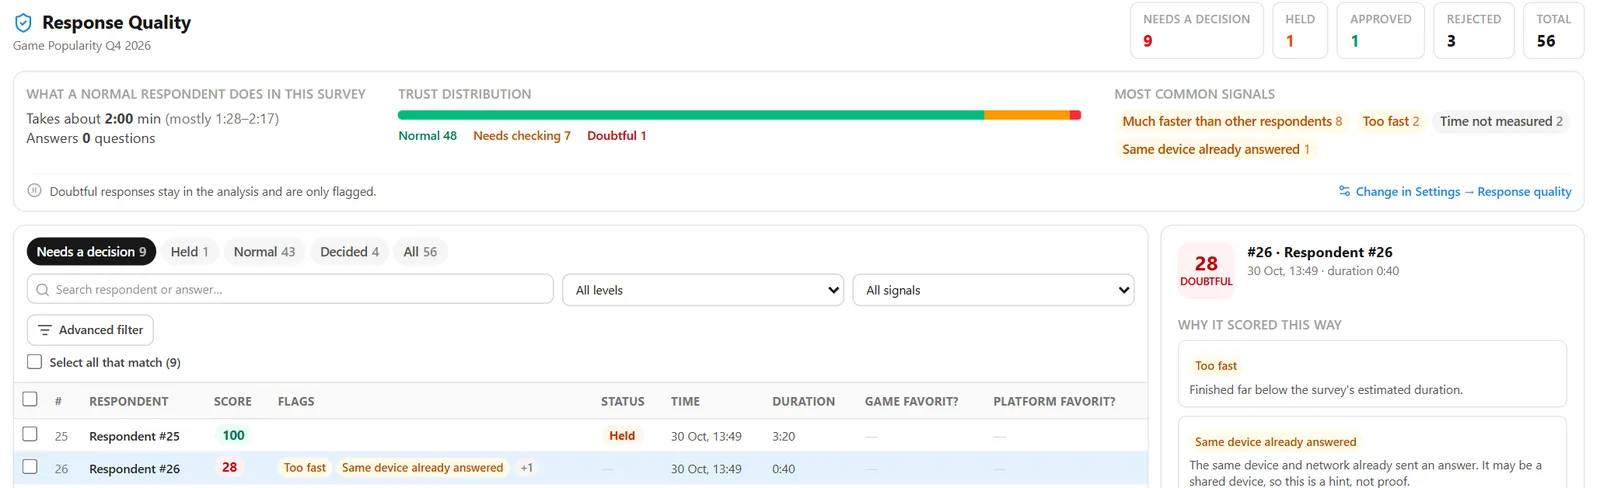
Every response starts at 100 and loses points for what it shows: a hidden honeypot field filled in, answers identical to another respondent, the same device submitting twice, a finish far faster than everyone else. The reasons are written next to the score.

  • 20 signals, each with a published weight
  • Normal 80–100, needs checking 46–79, doubtful 0–45
  • A shared device can look like a duplicate — so it is a hint, not proof
Online link survey
One response explained: 28, doubtful — too fast, same device, far faster than the rest
One response explained: 28, doubtful — too fast, same device, far faster than the restDemo data

02 / 04

The fear

People rushed through without reading.

The proof

Speed and patterns, measured against this survey's own respondents

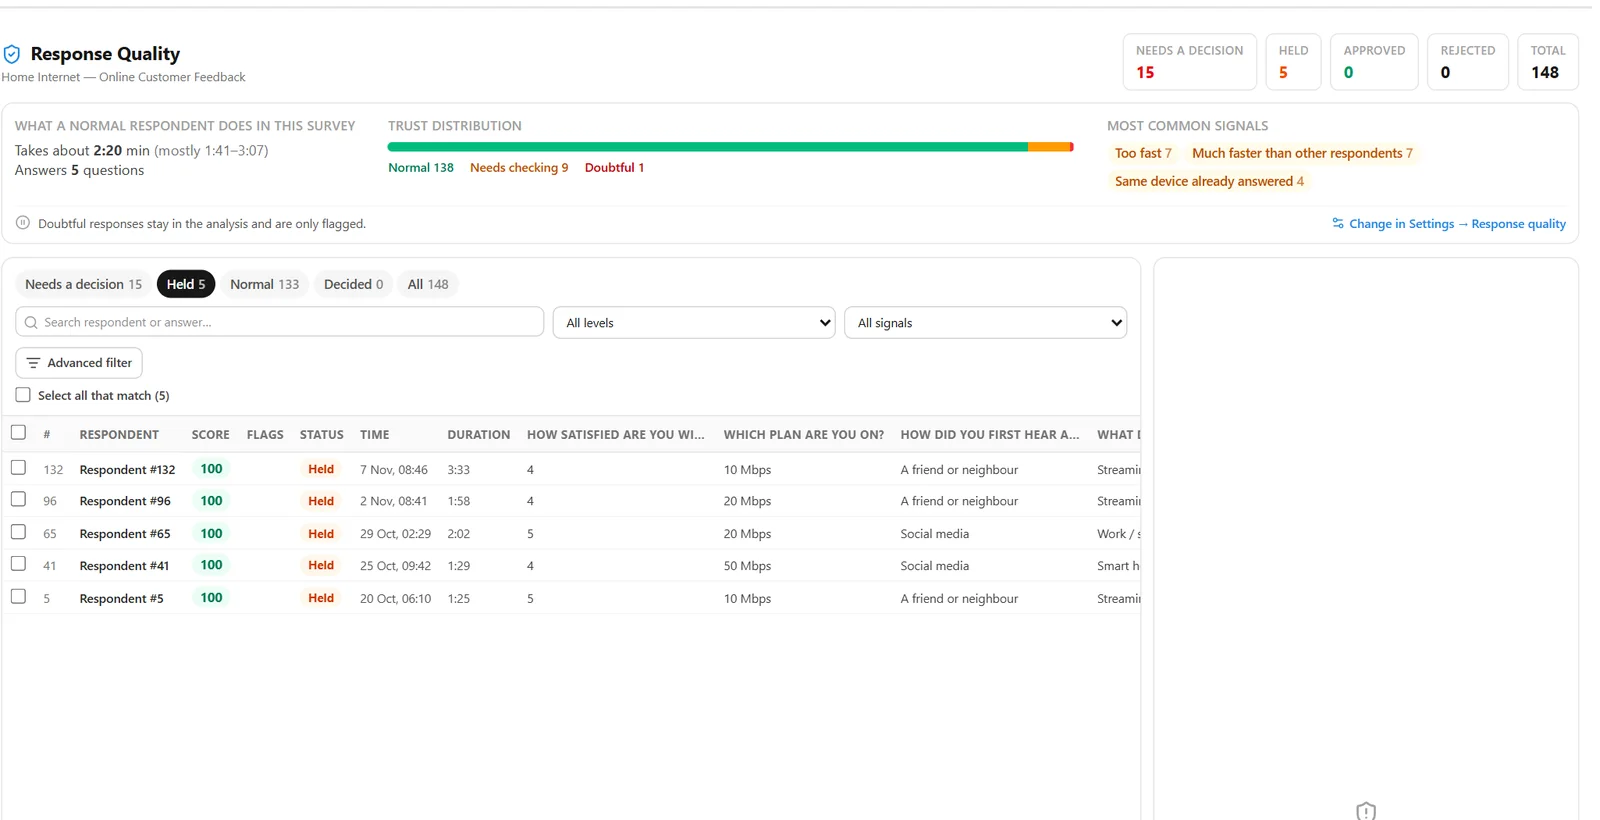
The platform learns what a normal respondent does in this survey — how long they take, how many questions they answer — and flags what falls far outside it. Straightlining, always-the-same-option and zig-zag patterns are picked up too.
  • Comparisons start only after 30 responses, so early ones are not judged against noise
  • The most common signals shown at the top
  • A needs-a-decision queue for the responses worth a look
Online link survey
Response Quality — what normal looks like, the trust distribution, the queue
Response Quality — what normal looks like, the trust distribution, the queueDemo data

03 / 04

The fear

The link was forwarded, or one person filled it in twice.

The proof

Control who can answer, and how often

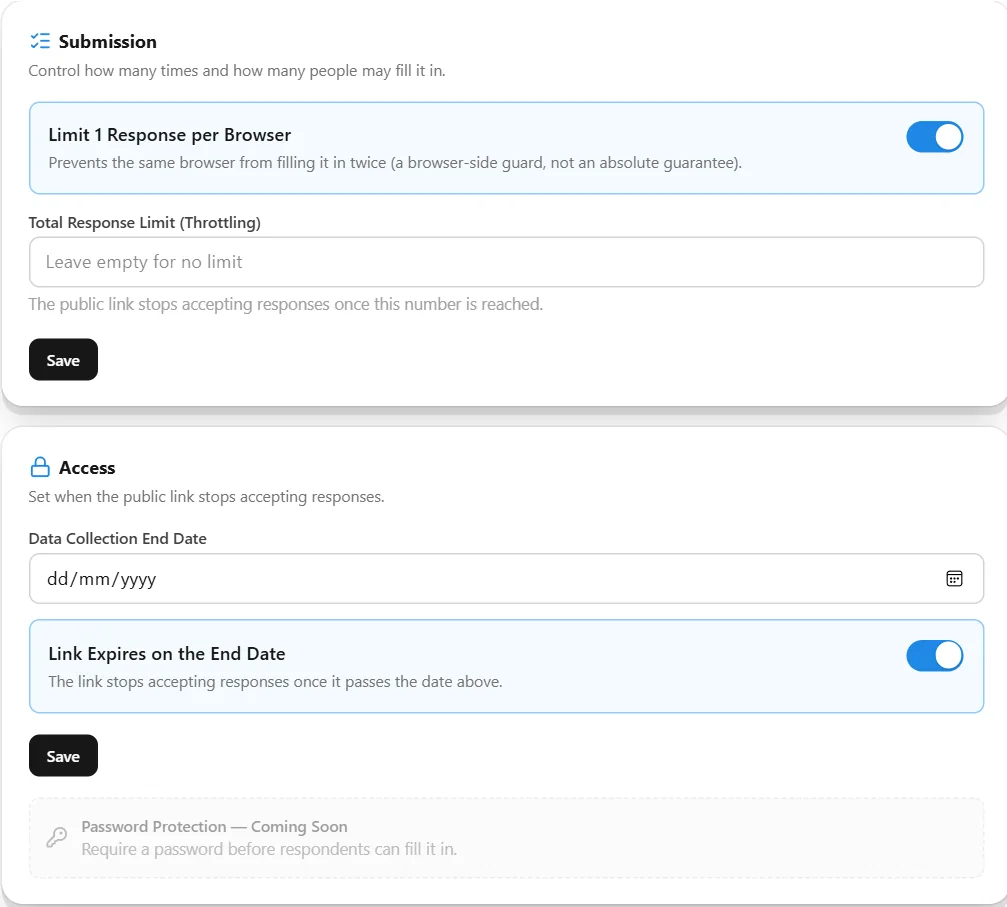
Limit responses per browser, cap the total, and close the link on an end date. In Structured surveys, each respondent gets a personal link or access code from the sample, so a forwarded link is visible for what it is.

  • One response per browser (a browser-side guard)
  • A total limit and an expiry date
  • Personal links and access codes in Structured surveys
Online link survey
Survey settings — submission limits and link expiry
Survey settings — submission limits and link expiryDemo data

04 / 04

The fear

Suspect answers quietly end up in the results.

The proof

Hold mode: nothing doubtful counts until a person decides

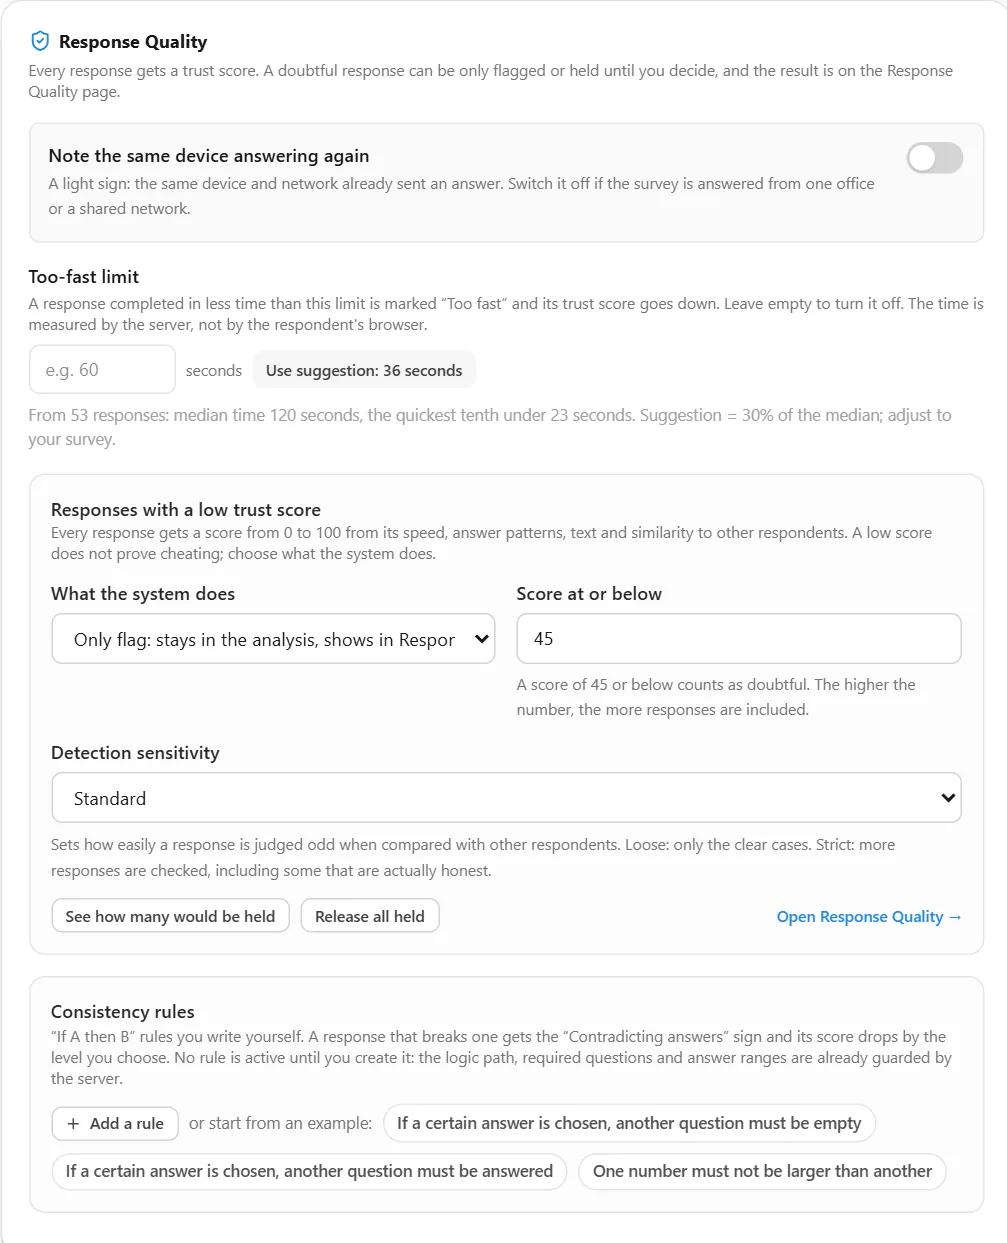
Choose what the system does with a low score: flag it and keep it, or hold it out of the analysis until someone approves or rejects it. Add a too-fast limit — the platform suggests one — and your own consistency rules.

  • Flag only, or hold until reviewed
  • A suggested too-fast limit, worked out from your own data
  • “If A then B” consistency rules you write yourself
Online link survey
Response quality settings — score threshold, hold mode, consistency rules
Response quality settings — score threshold, hold mode, consistency rulesDemo data
Method 04 of 4Basic only

Voice Survey

Self-completed, but answered out loud.

The fearOpen answers flattened into something the respondent never meant.

Method 04 · Voice Survey

Respondents answer out loud. Their own words are kept.

Open answers are where meaning gets lost — typed in a hurry, or summarised by someone else. In a Voice Survey, respondents speak their answers. The recording is kept, written out, and summarised with checks that keep the summary honest.

Fear → proof

Keep scrolling — the proofs move sideways → Swipe sideways →

01 / 04

The fear

Open answers get flattened into something the respondent never meant.

The proof

An AI version per answer — one click from the original words

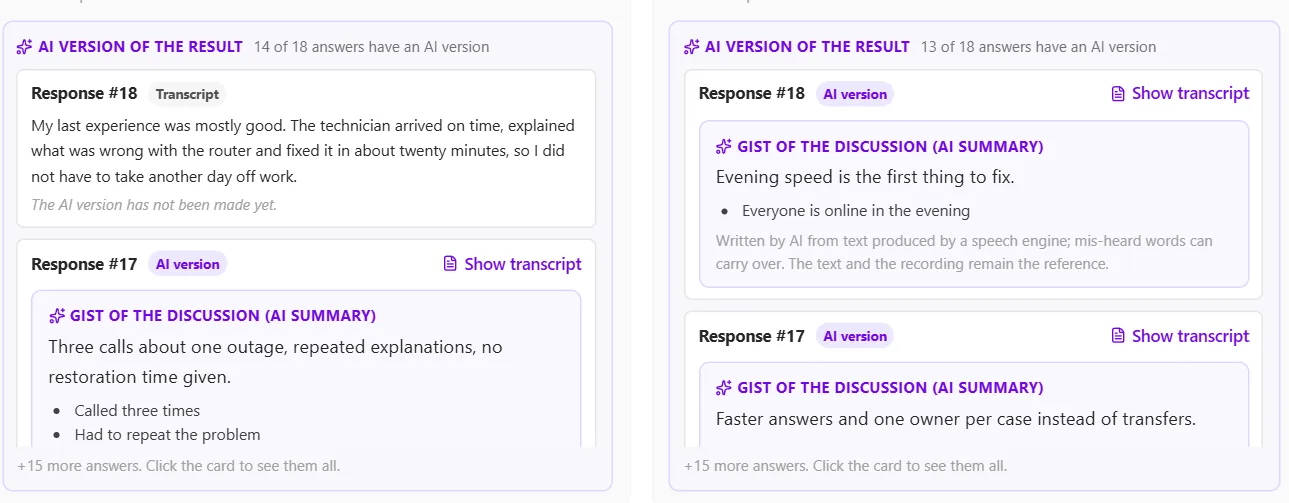
Each spoken answer gets a short summary and its key points. One click switches back to the full transcript, so a reader always sees what the summary came from.

  • Summaries only for answers long enough to summarise
  • Shown inside each question card
  • Also under each answer when you read one respondent
Voice Survey
Question cards — the AI version, and the switch to the transcript
Question cards — the AI version, and the switch to the transcriptDemo data

02 / 04

The fear

Audio that is silent, unclear or misheard goes unnoticed.

The proof

Every recording, written out and correctable

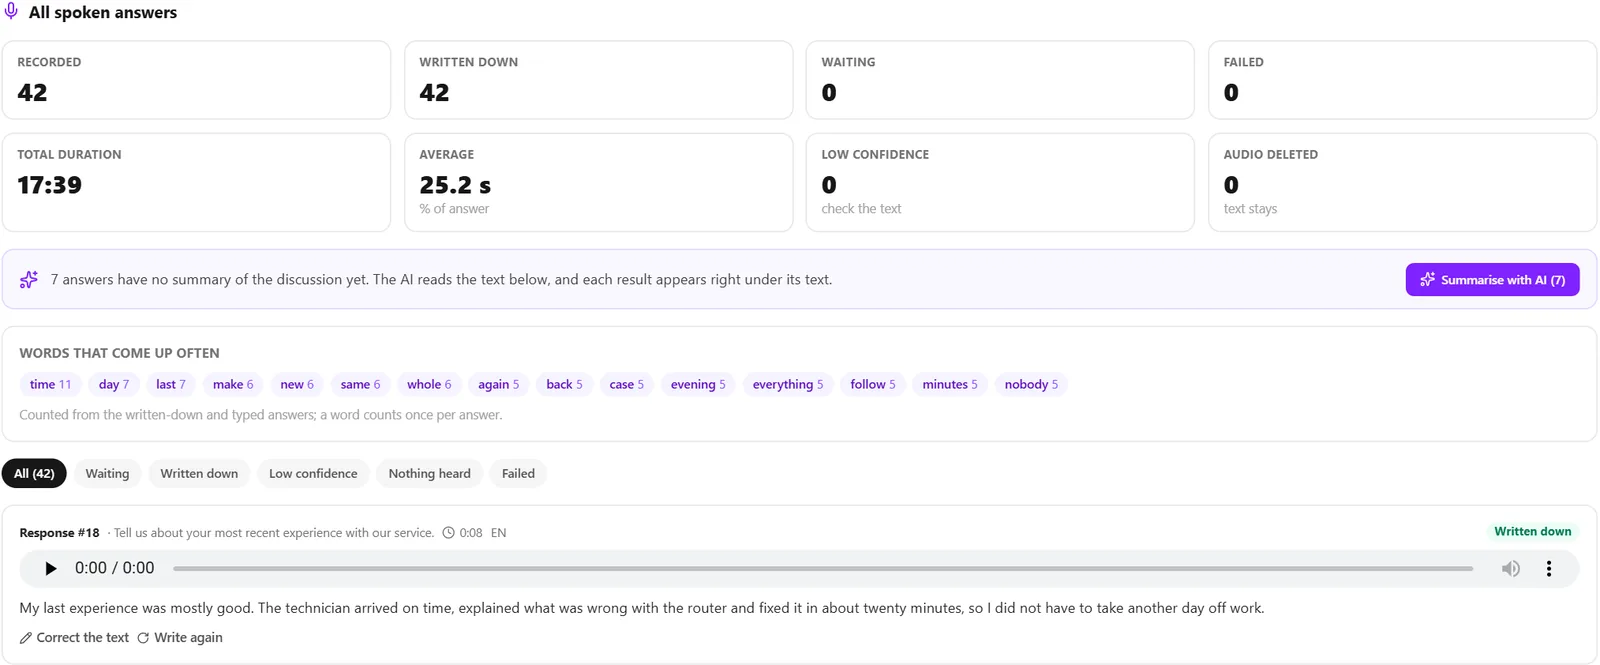
All spoken answers in one place: the recording, the transcript, its length and language. A person can correct a transcript — the correction is marked — and silent, too-short and hard-to-transcribe answers are flagged.

  • Filter by waiting, written down, low confidence, nothing heard
  • Words that come up often across all answers
  • Corrected text replaces the machine text — visibly
Voice Survey
All spoken answers — recordings, transcripts, frequent words
All spoken answers — recordings, transcripts, frequent wordsDemo data

03 / 04

The fear

The AI summary quietly invents a number or a name.

The proof

Summaries checked against the transcript

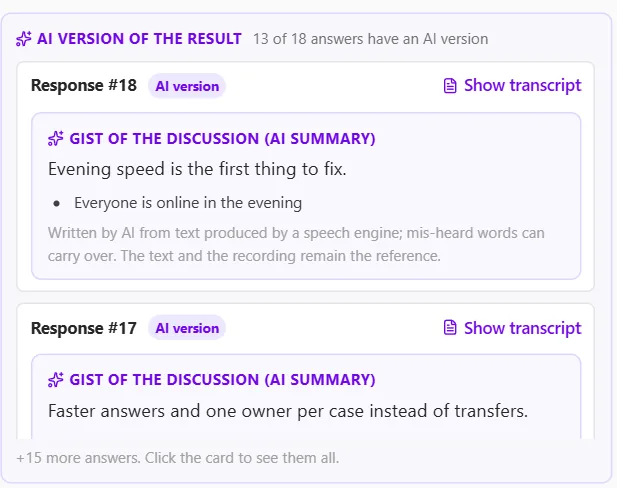
Numbers, quotes and names in a summary are checked back against the transcript; anything that cannot be found is marked. Personal data is masked before any text is sent. The transcript and the recording remain the reference.

  • Summaries are stored with the text they came from
  • Correct the text, and the summary is marked out of date
  • The audio itself is never sent to the AI
Voice Survey
An AI version, with the note that the text and the recording remain the reference
An AI version, with the note that the text and the recording remain the referenceDemo data

04 / 04

The fear

Respondents never really agreed to be recorded — or the audio is kept forever.

The proof

Consent first, and audio kept only as long as you decide

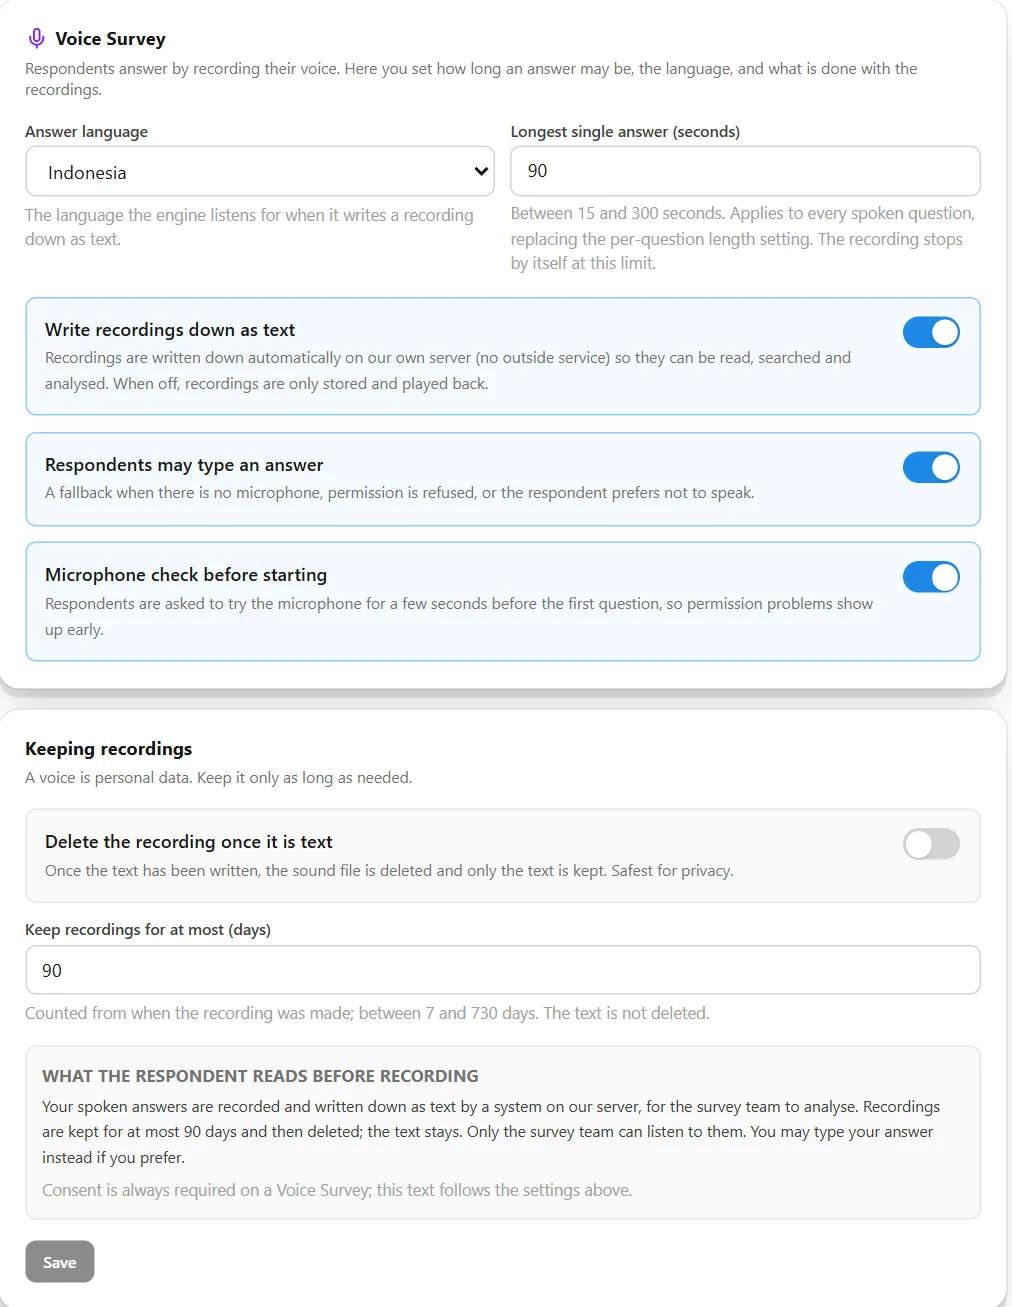
Consent is always on in a Voice Survey: respondents read exactly what will happen to their voice before anything is recorded. Set how long recordings are kept, or delete each one as soon as it has been written out.

  • Respondents may type instead of speaking
  • A microphone check before the first question
  • Retention from 7 to 730 days, or delete after transcription
Voice Survey
Voice settings — language, length, typing fallback, retention and consent text
Voice settings — language, length, typing fallback, retention and consent textDemo data

Main features

Main features, method by method

Each method has its own working screens. Below are the features used most for each one, with their real screens. The label above every image names the screen or view it shows.

01

Field survey

Advanced only

Live tracking

See the field team as it works.

Each interviewer's latest position, an eight-hour trail and who has gone quiet, on one map. Alerts fire for going offline, leaving the area, low battery, faked locations and targets reached.

Live Map · latest positions and trails

Live tracking
Live Map · latest positions and trails

Technical analysis

The whole fieldwork on one page, six ways to read it.

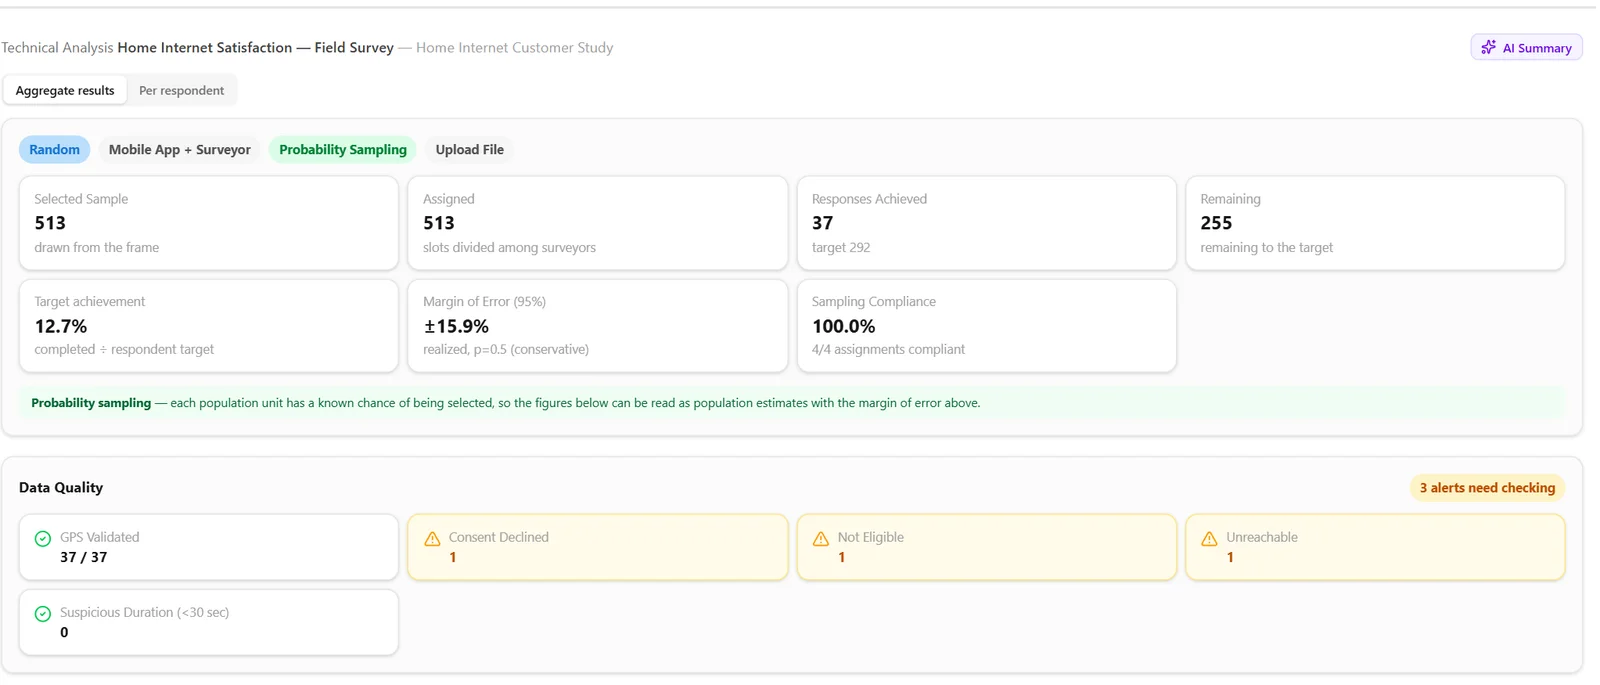
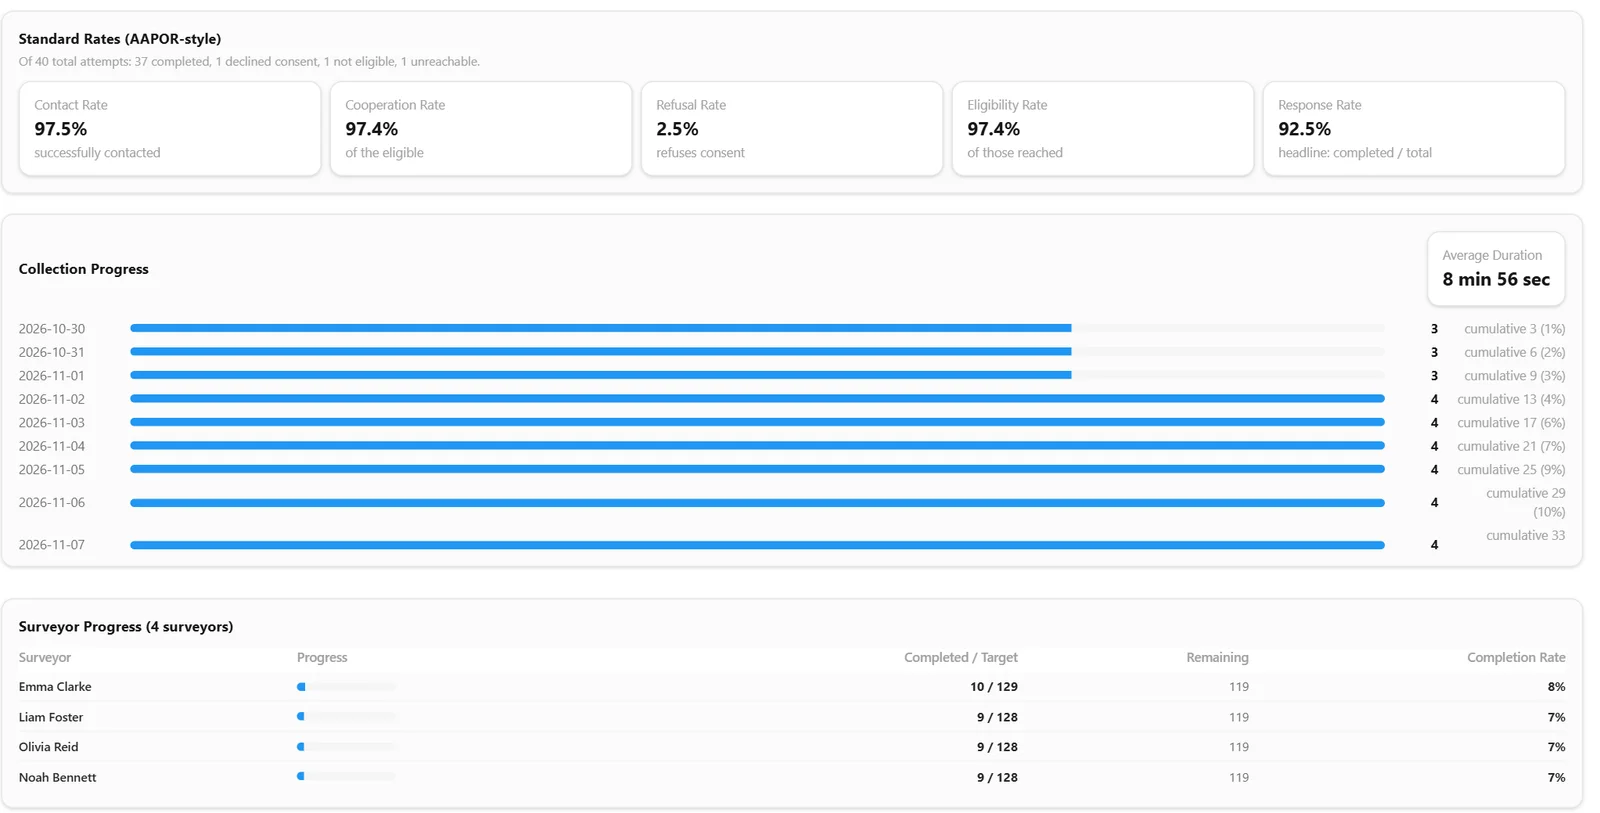
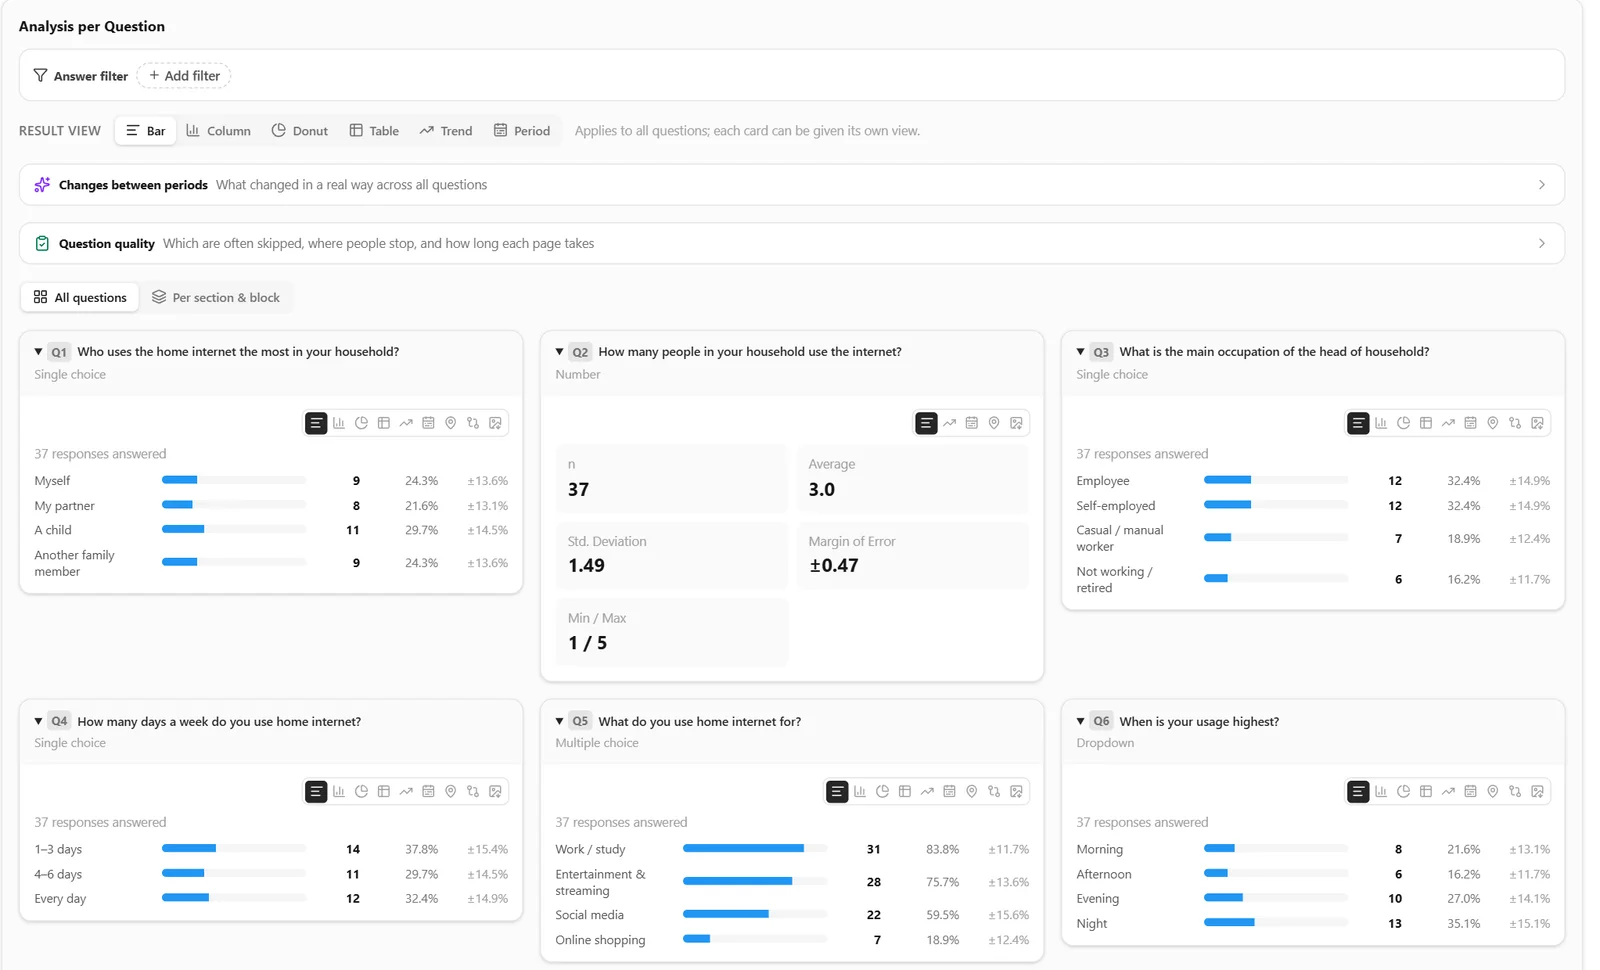
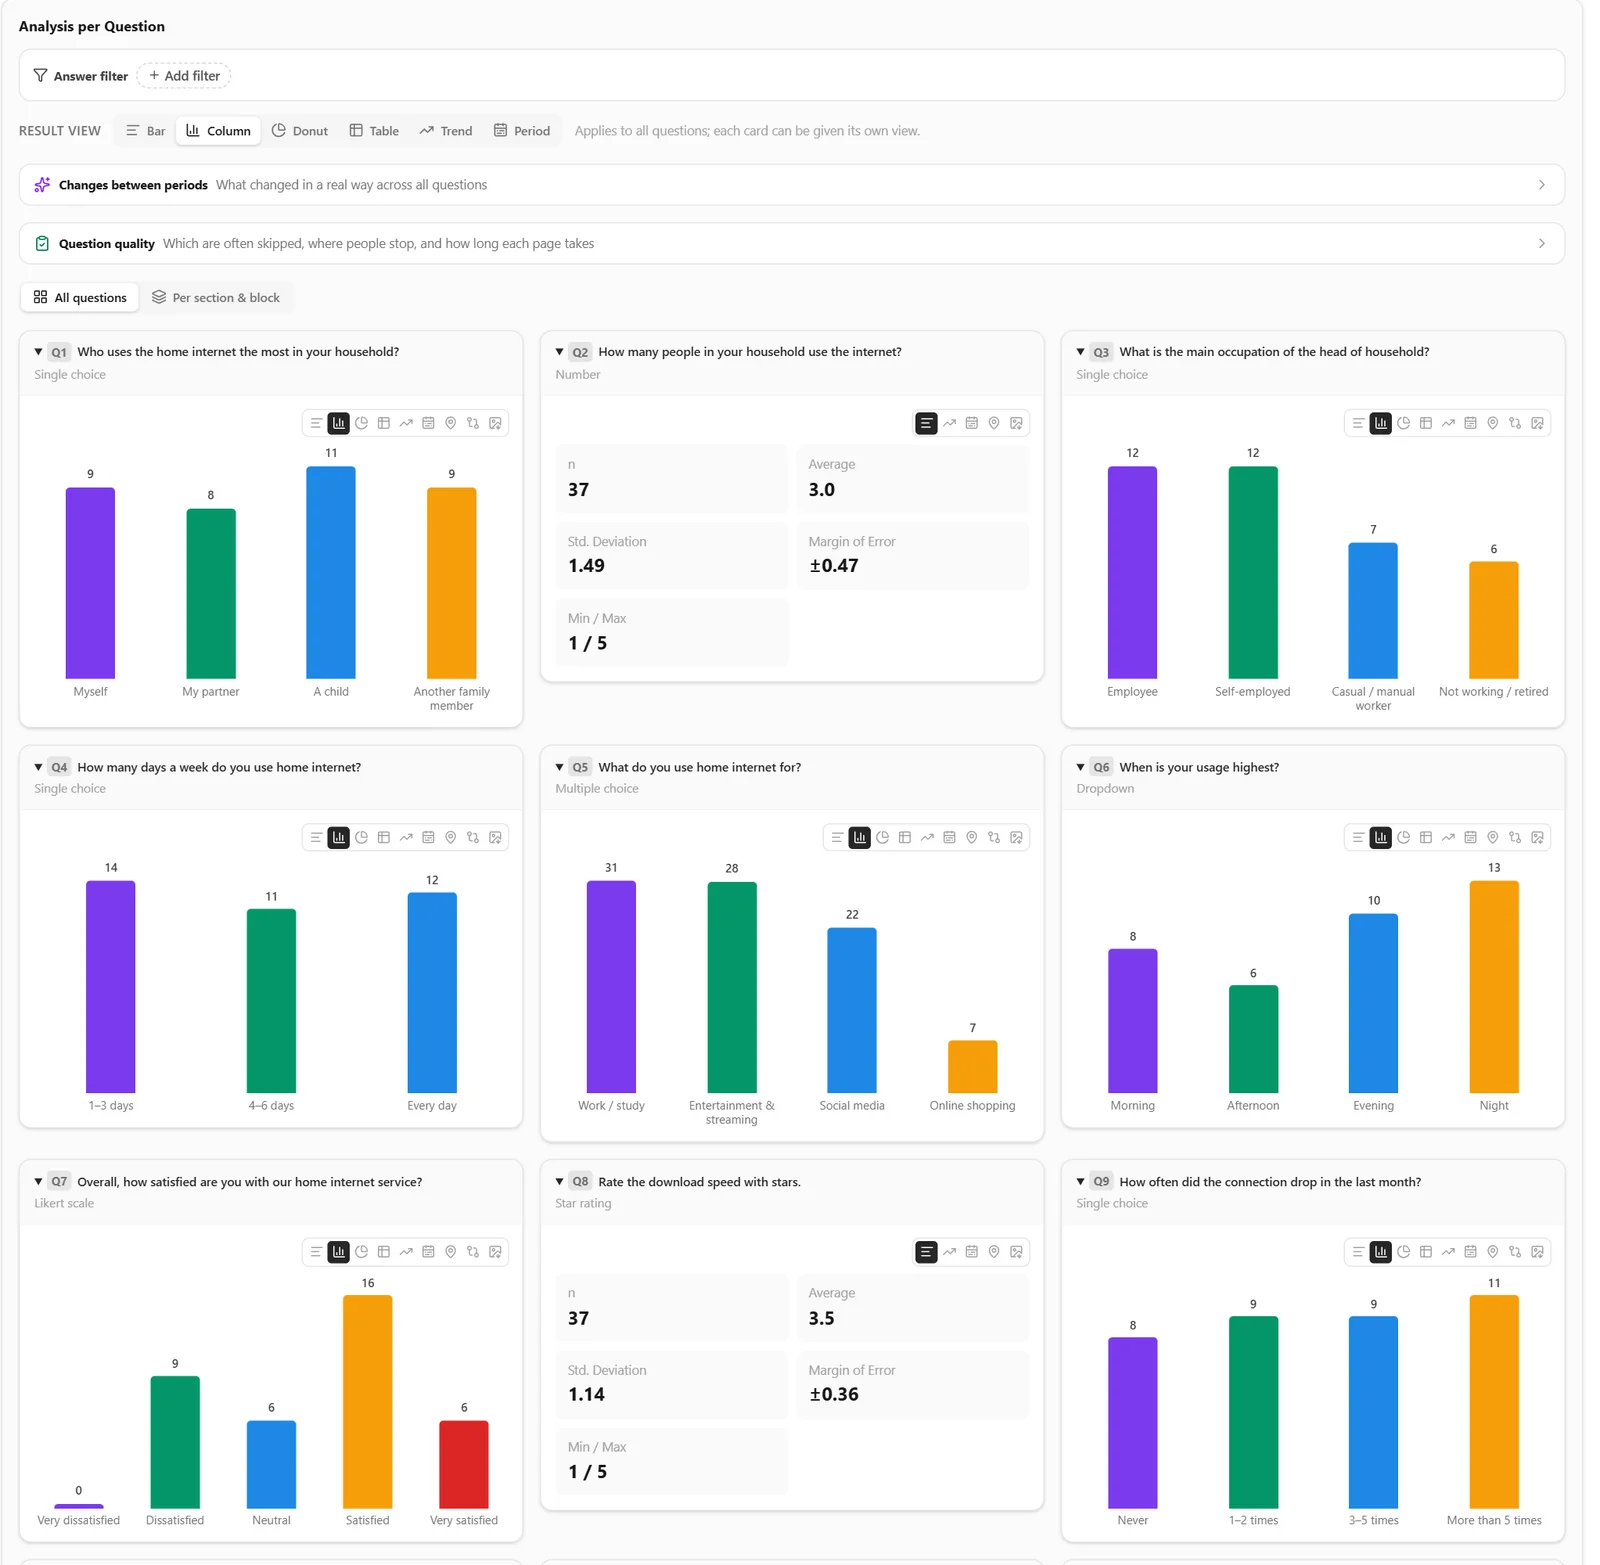
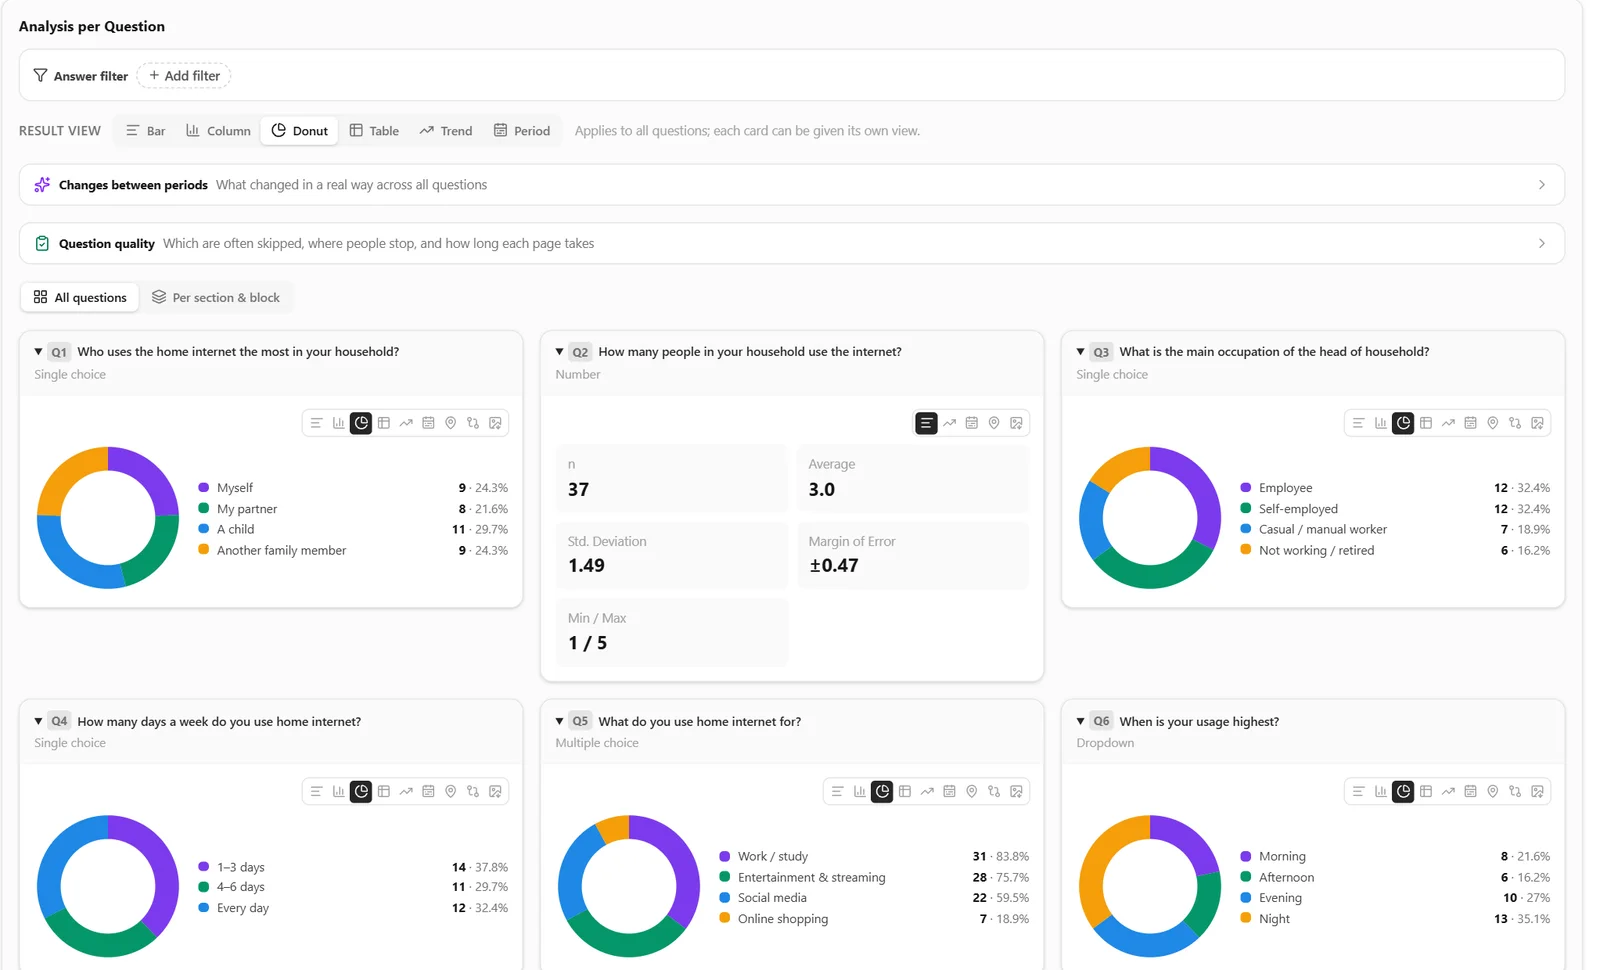
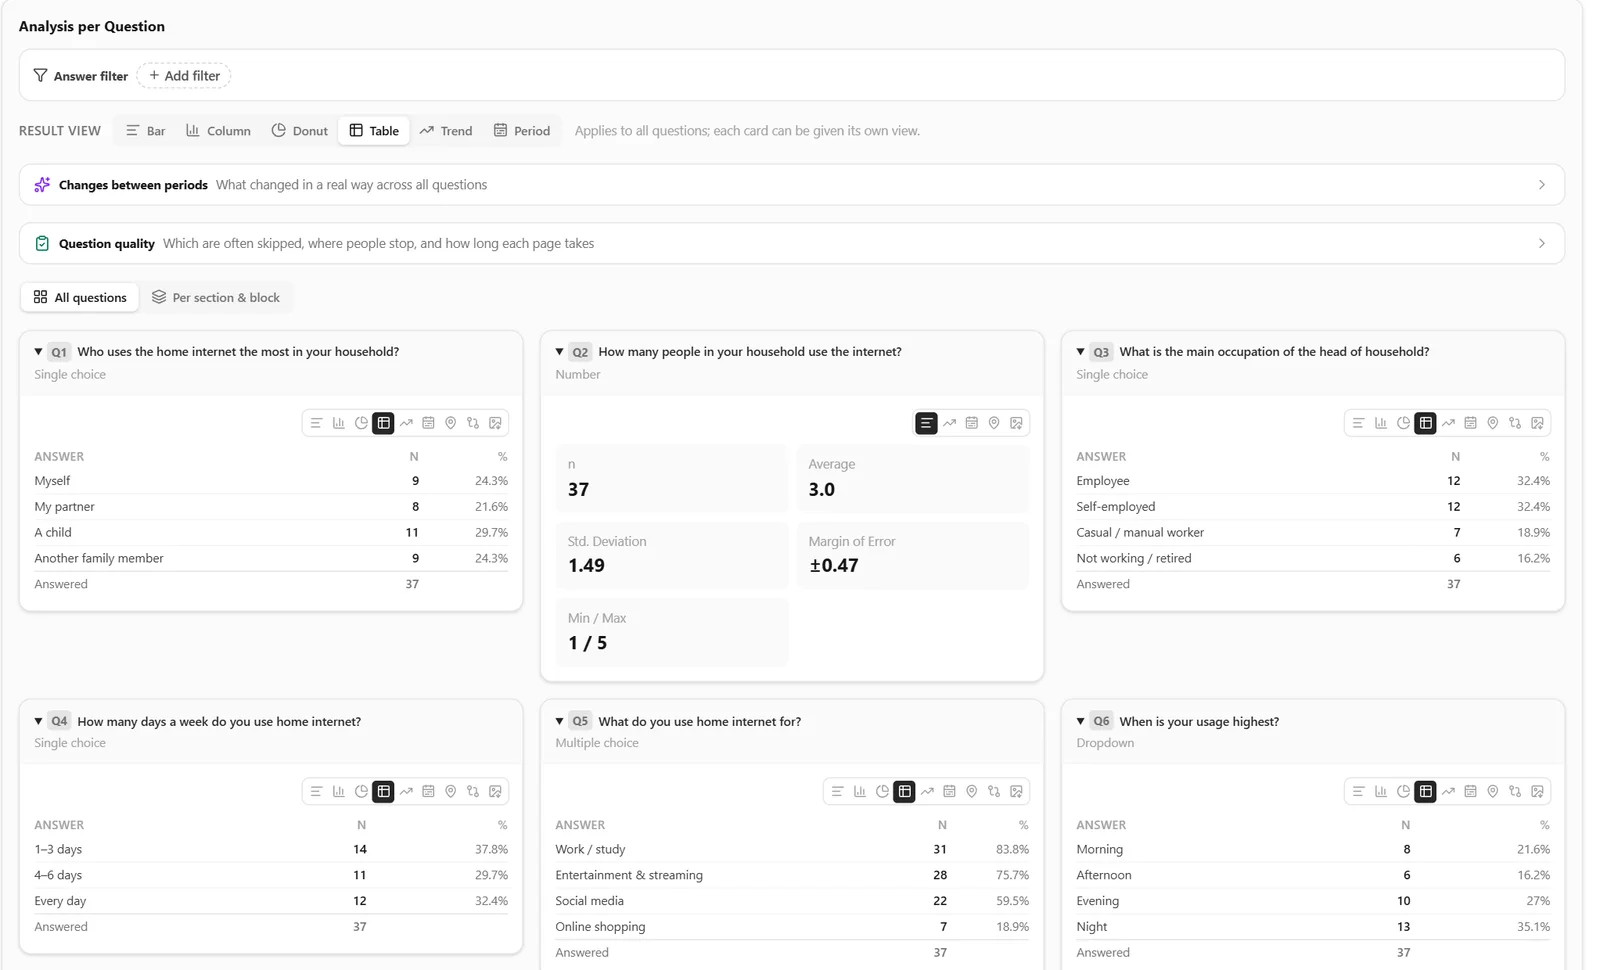
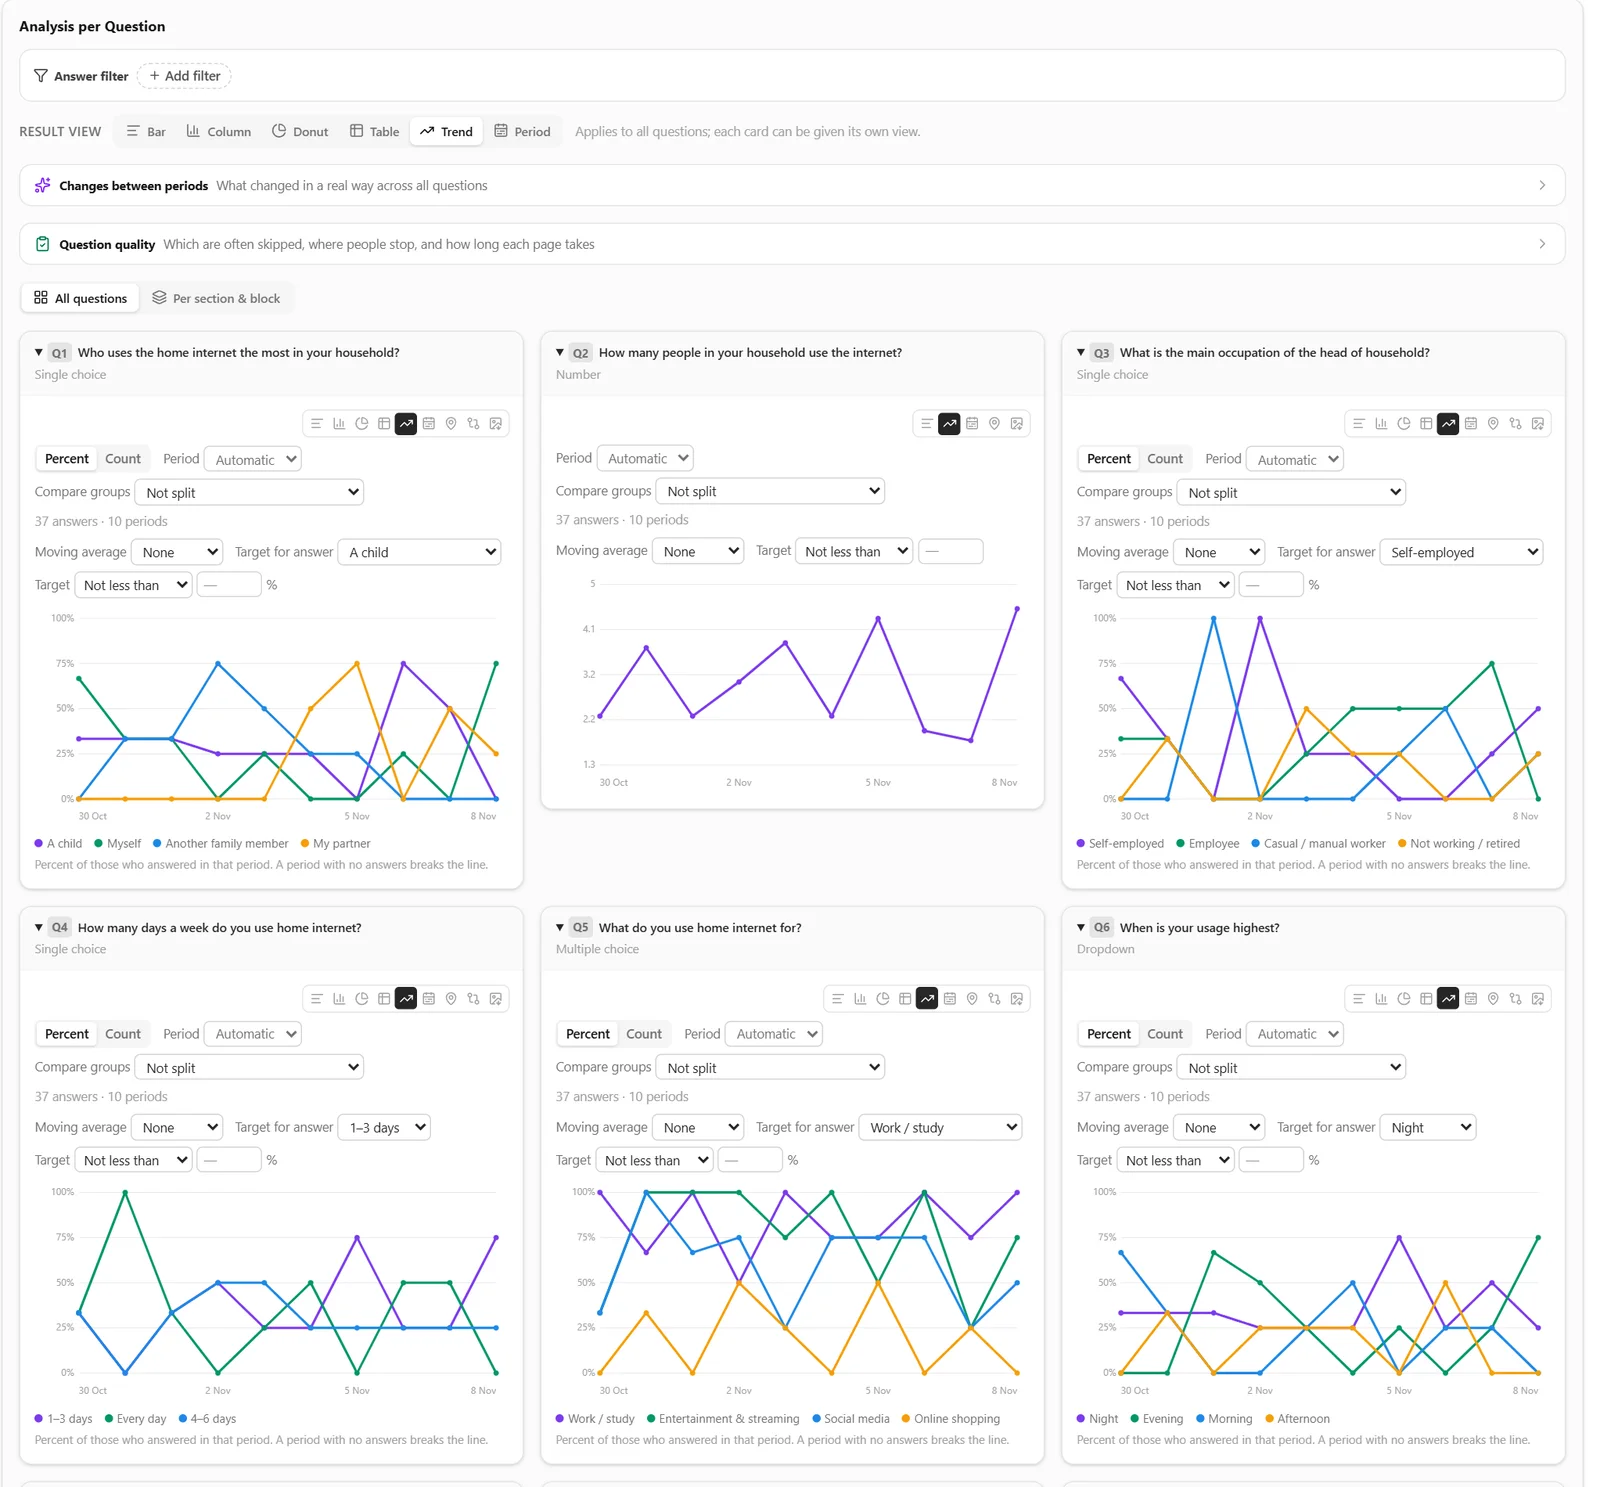
Sample, target, margin of error, data quality and AAPOR-style rates at the top; progress by day and by interviewer; then every question as bar, column, donut, table or trend. A view can be set for all questions at once or per card.

Views

  • Overview · sample, target, margin of error
  • AAPOR-style rates & progress
  • Bar view
  • Column view
  • Donut view
  • Table view
  • Trend view
Overview · sample, target, margin of error
Technical analysis
Overview · sample, target, margin of error
AAPOR-style rates & progress
Technical analysis
AAPOR-style rates & progress
Bar view
Technical analysis
Bar view
Column view
Technical analysis
Column view
Donut view
Technical analysis
Donut view
Table view
Technical analysis
Table view
Trend view
Technical analysis
Trend view

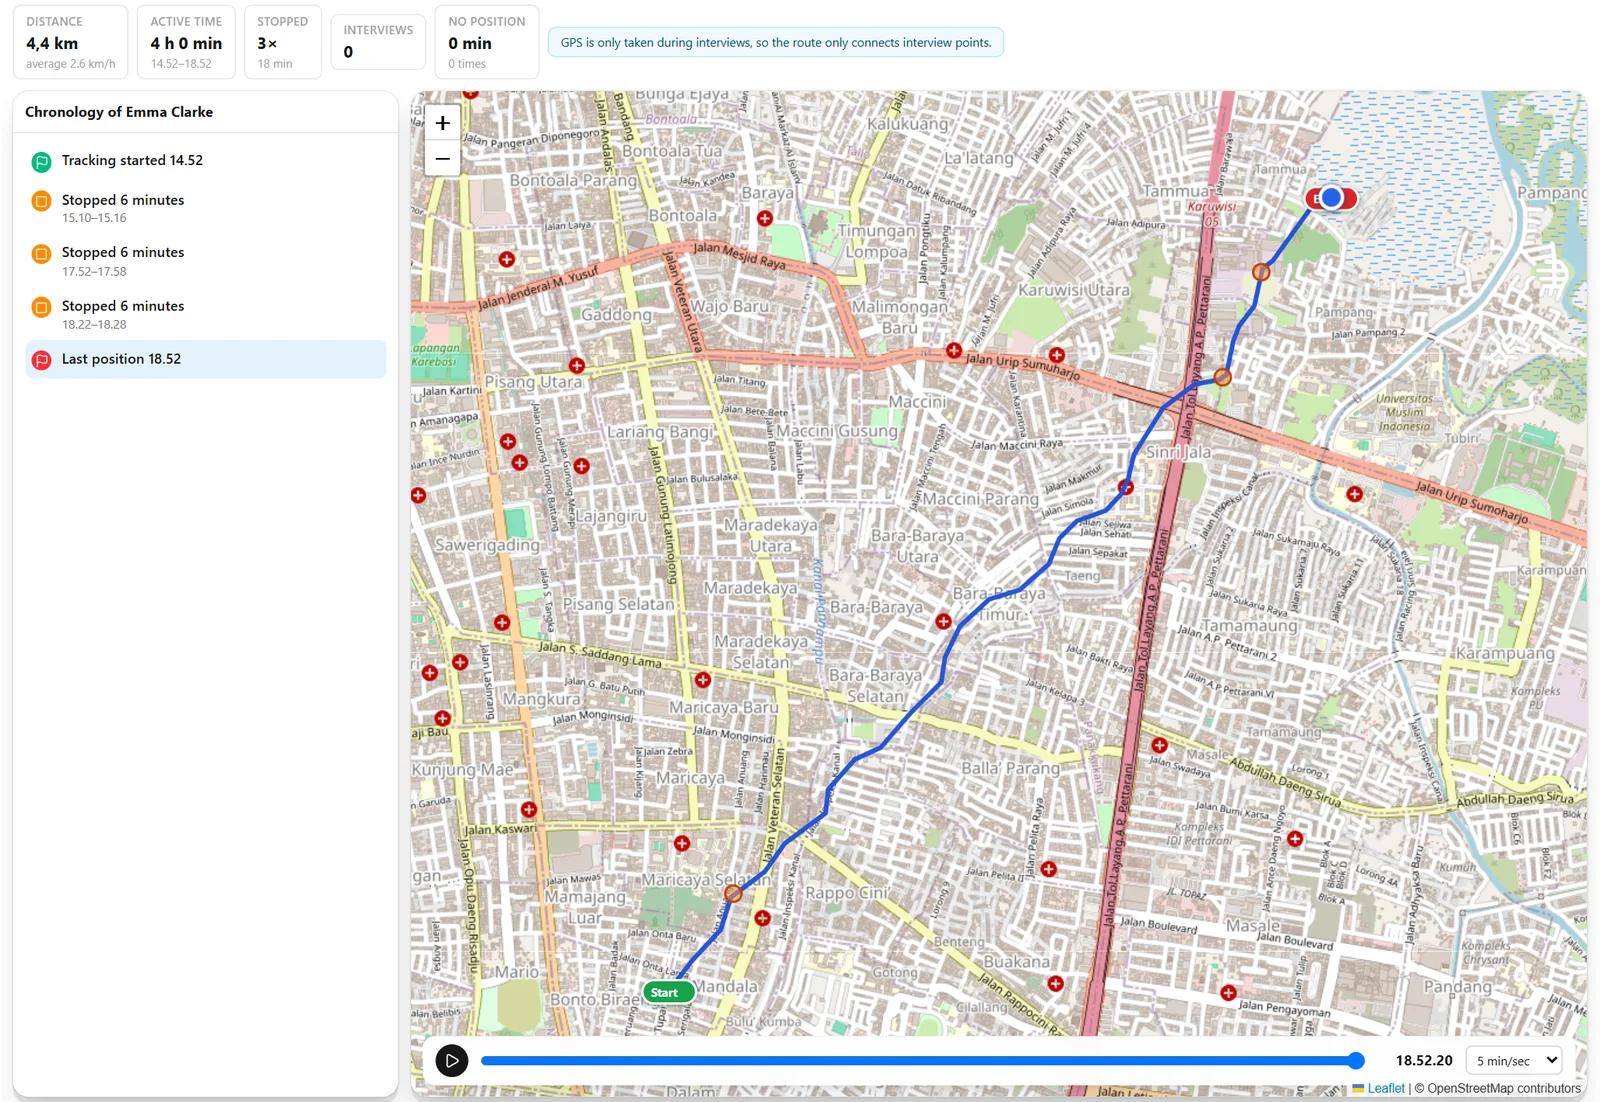
Route history

Where an interviewer went, minute by minute.

Distance, active time and stops per day; a chronology from the start of tracking to the last position; and a route you can replay, with the interview points along the way.

Route History · replayable

Route history
Route History · replayable

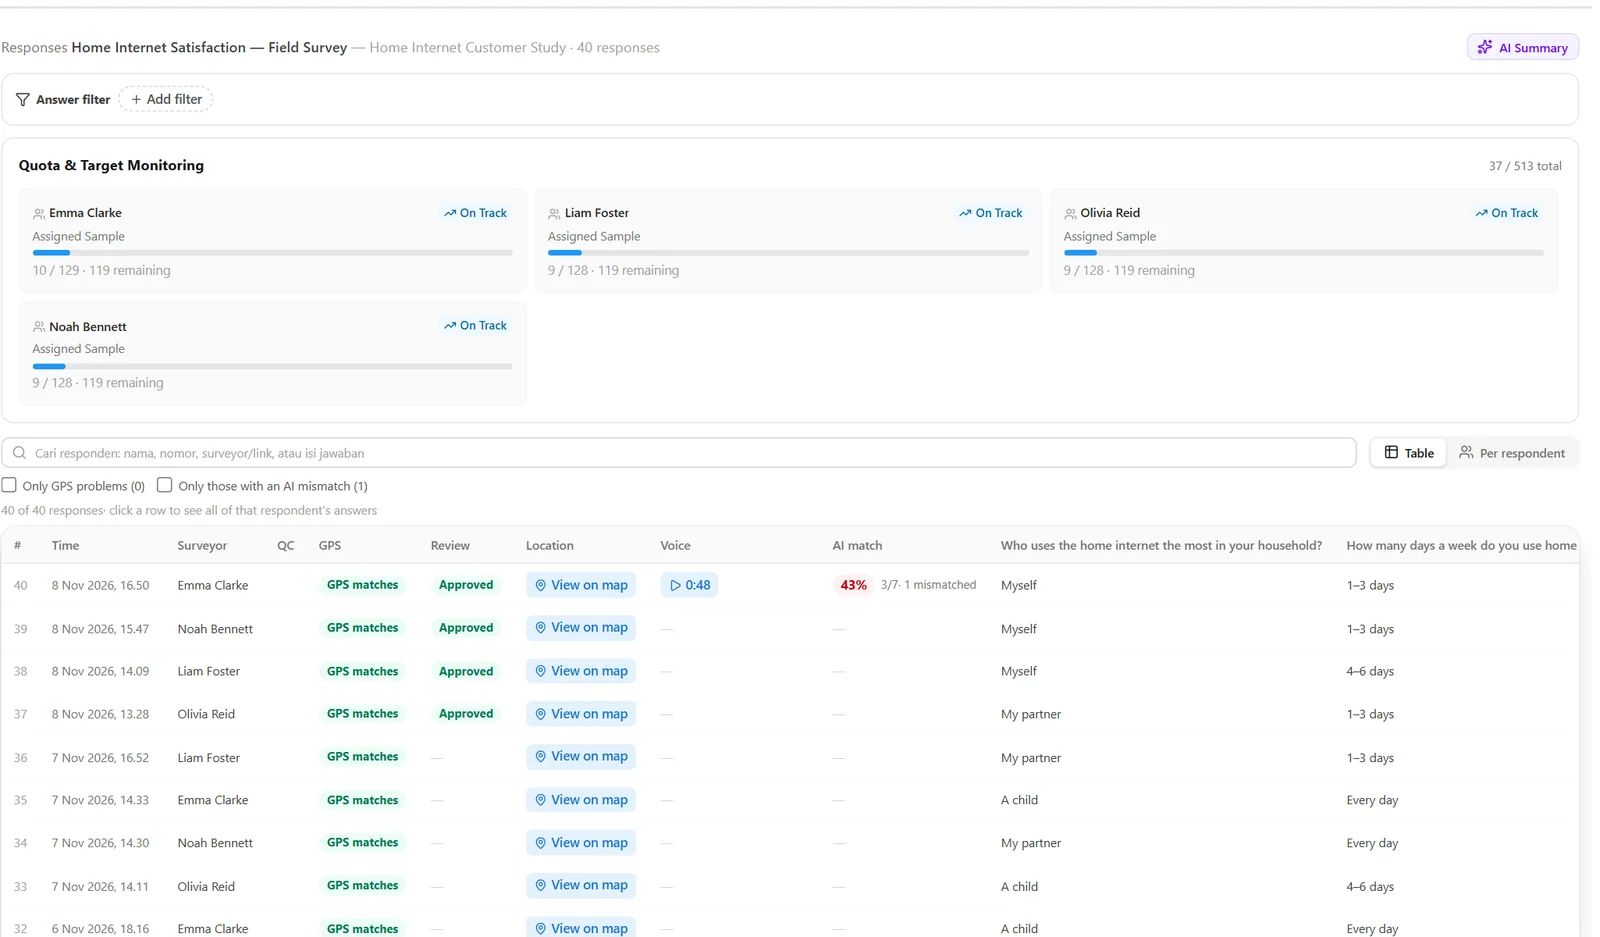
Responses & quotas

Every interviewer's target and every interview, in one table.

Quota cards show who is on track; the table below records the GPS check, review status, map location, recording and AI check of every interview.

Responses · quota monitoring

Responses & quotas
Responses · quota monitoring
02

Phone survey

Basic and Advanced

Call Console

Every call started and logged in one place.

The caller starts the call, reads the instructions from the office and fills in the answers during the conversation. The latest calls show who called, when, for how long and the outcome: completed, unreachable or refused.

Call Console · latest calls

Call Console
Call Console · latest calls

NPS results & metrics

Score, mix and reasons, right after the calls.

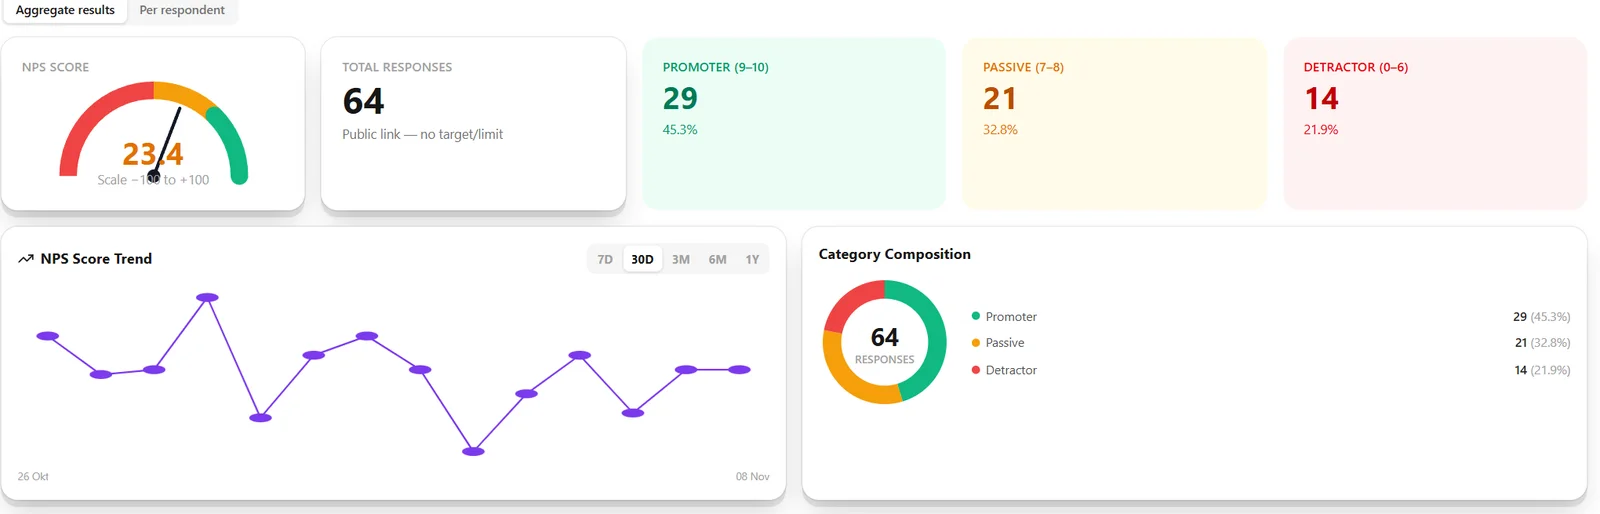
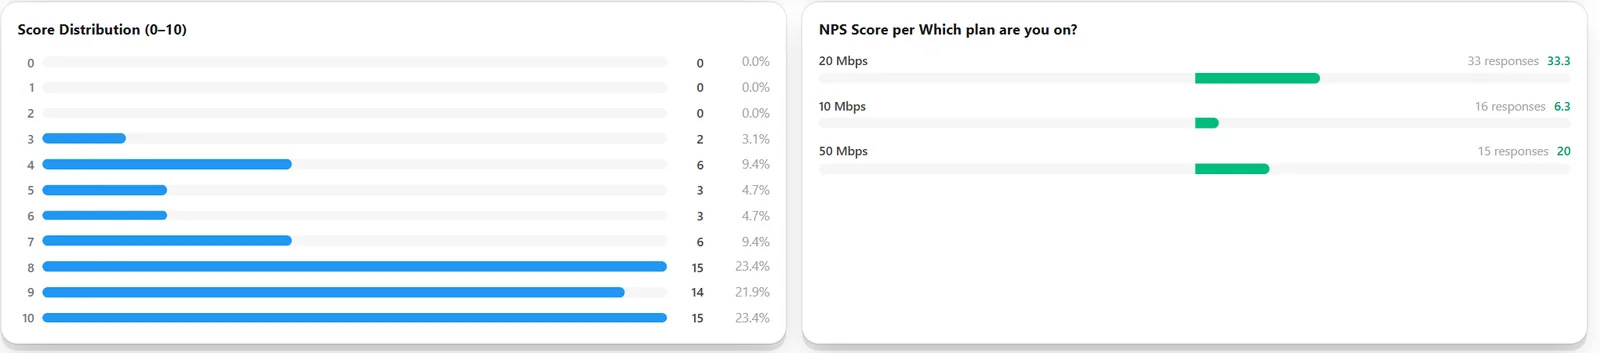
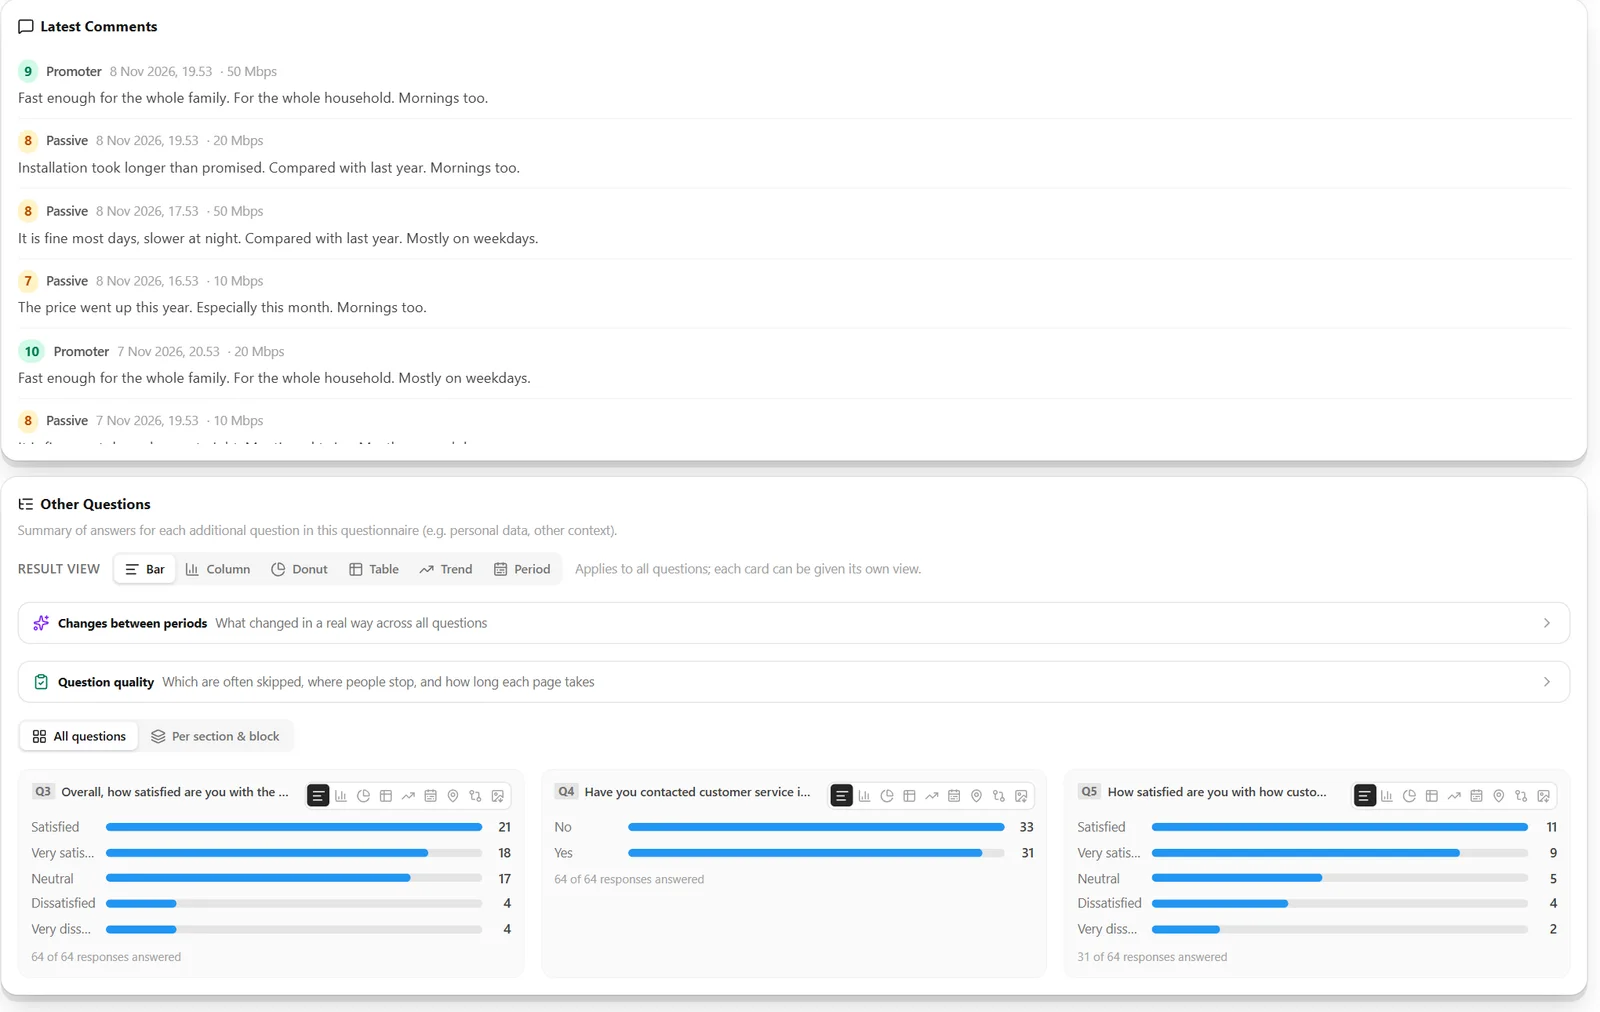
The NPS template has its own dashboard: the score on a gauge, promoters, passives and detractors, the score trend, the 0–10 distribution, the score per segment, the latest comments and a summary of the other questions.

Views

  • NPS score, mix & trend
  • Score distribution & score per plan
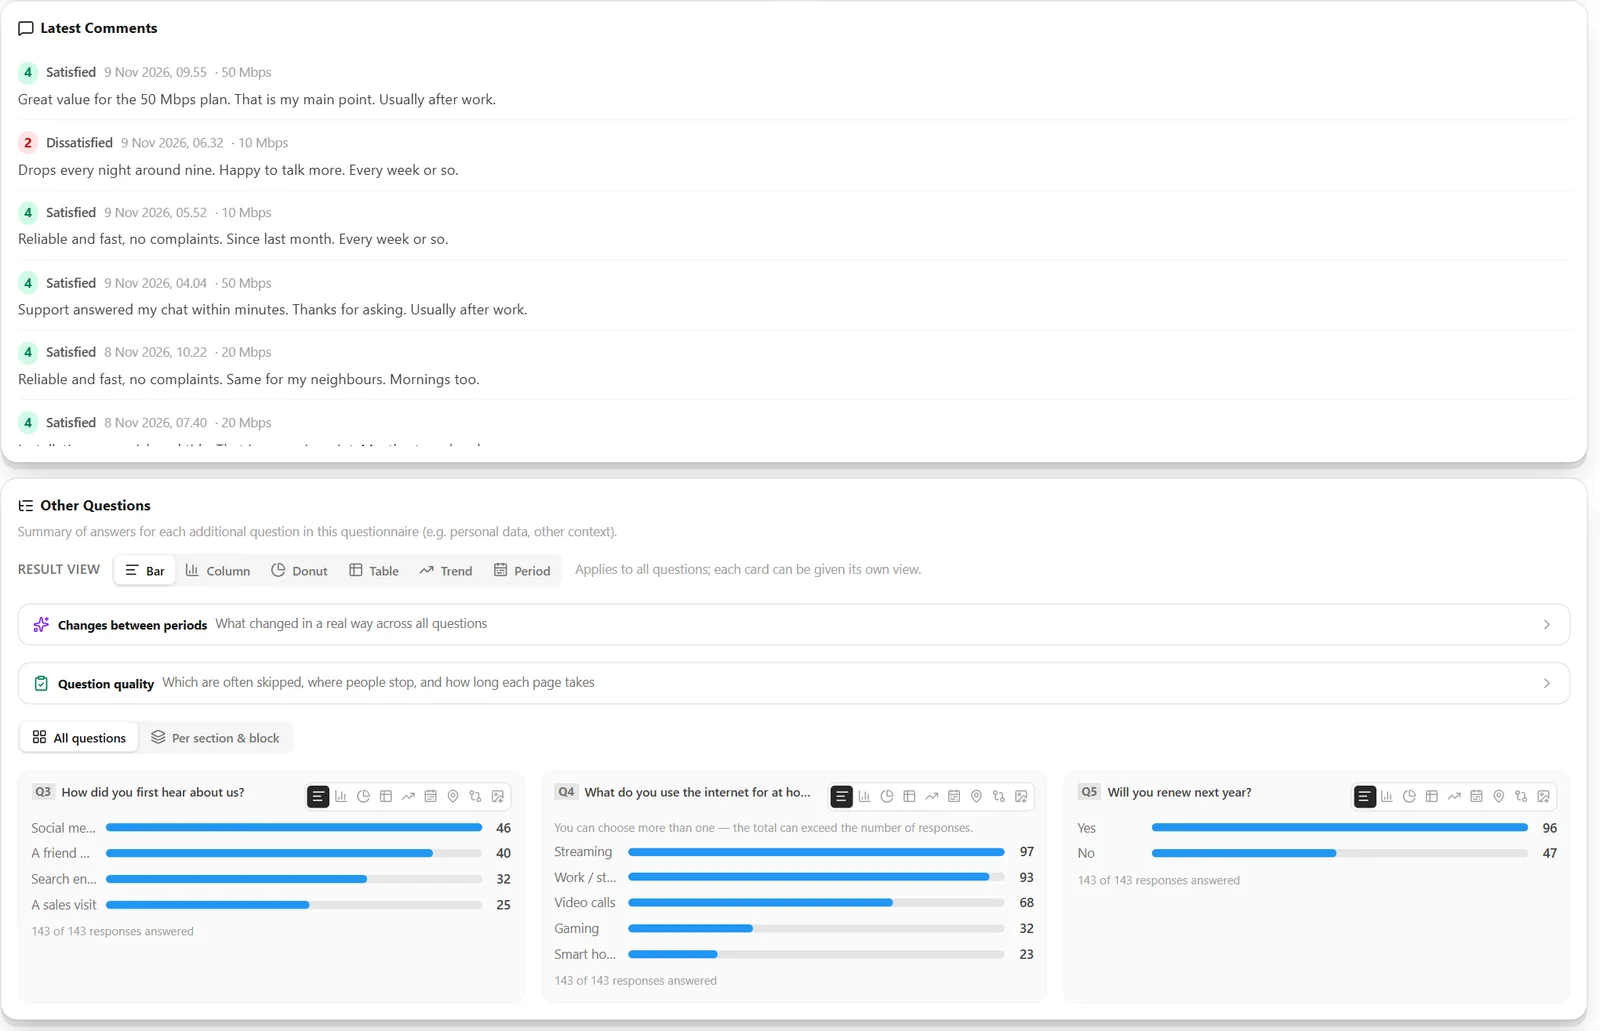
  • Latest comments & other questions
NPS score, mix & trend
NPS results & metrics
NPS score, mix & trend
Score distribution & score per plan
NPS results & metrics
Score distribution & score per plan
Latest comments & other questions
NPS results & metrics
Latest comments & other questions

Responses per call

Every answer tied to a number and a caller.

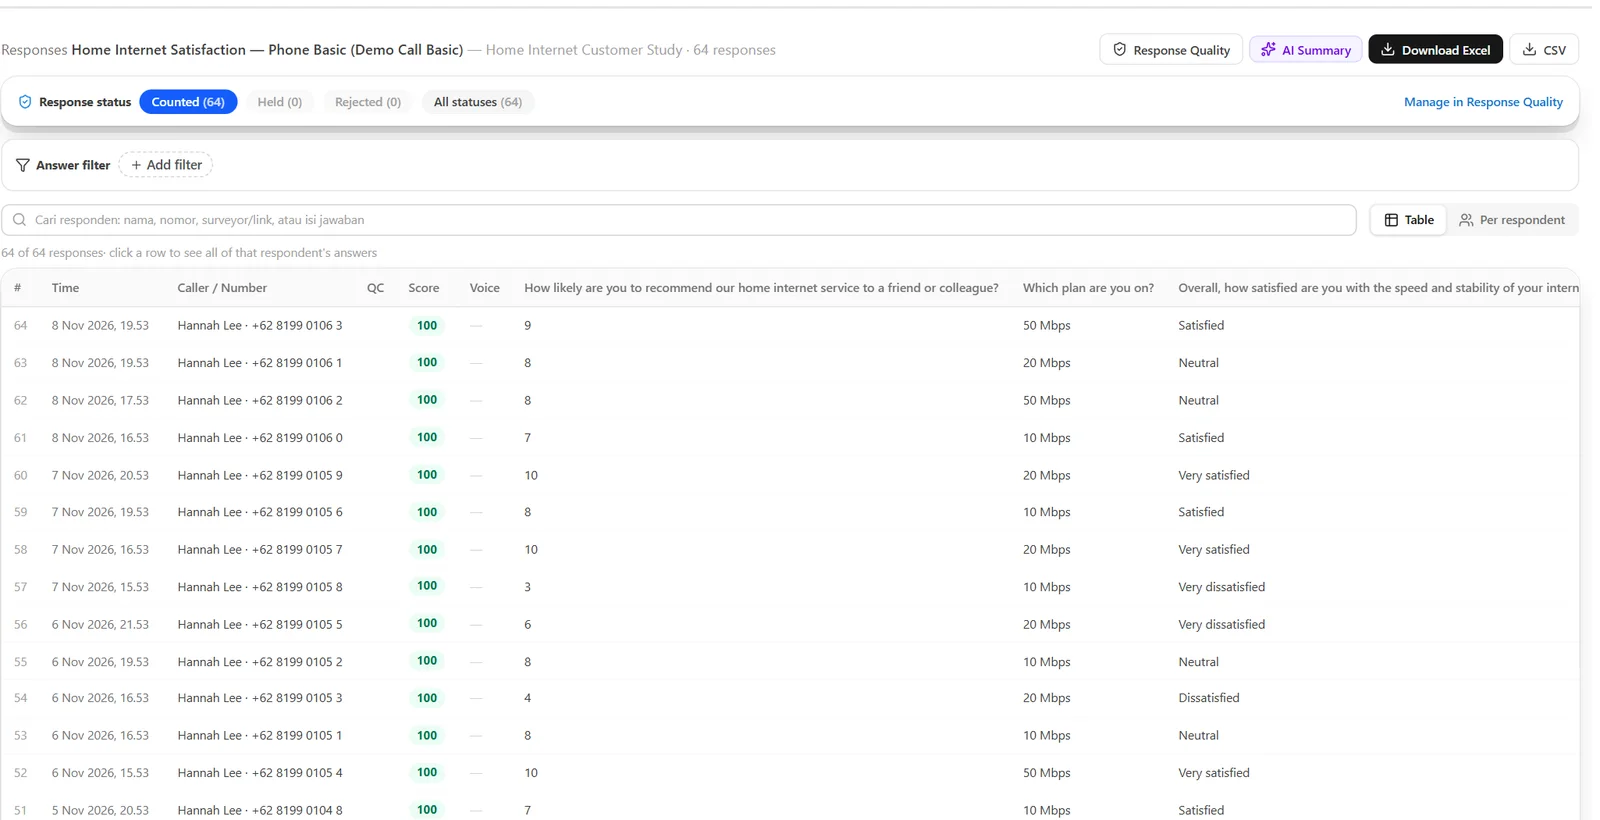
The responses table keeps the time, the caller, the number dialled and the trust score next to every answer, and downloads as Excel or CSV.

Responses · caller and number

Responses per call
Responses · caller and number

AI check on recordings

Typed answers compared with the recording.

Recordings are written out and every closed answer is checked: match, mismatch, listen again or not clearly heard, with the exact quote. This screenshot is from a field interview; the check is the same for calls.

AI check · one interview

AI check on recordings
AI check · one interview
03

Online link survey

Basic and Advanced

CSAT results & metrics

Customer satisfaction, readable while the link is still open.

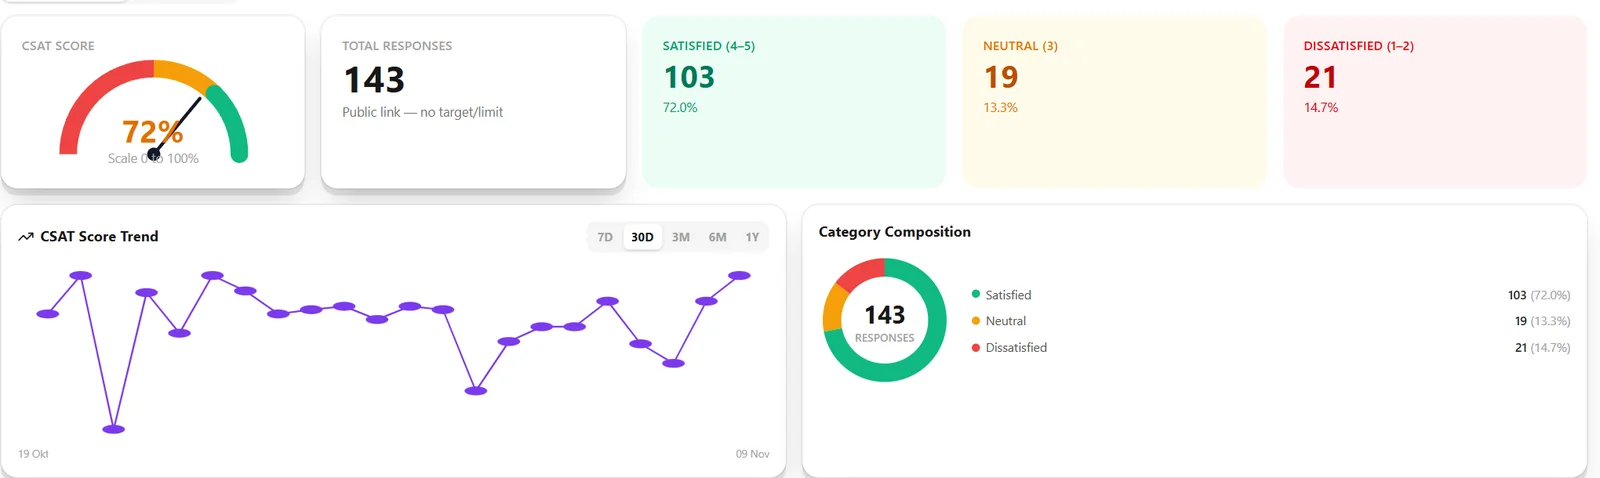
The CSAT template computes the satisfaction score, the satisfied / neutral / dissatisfied mix, the daily trend, the 1–5 distribution, the score per segment, the latest comments, and every other question as bar, column, donut, table or trend.

Views

  • CSAT score, mix & trend
  • Score distribution & score per plan
  • Latest comments & other questions
CSAT score, mix & trend
CSAT results & metrics
CSAT score, mix & trend
Score distribution & score per plan
CSAT results & metrics
Score distribution & score per plan
Latest comments & other questions
CSAT results & metrics
Latest comments & other questions

Response quality

Doubtful responses set apart before they reach the results.

What a normal respondent looks like in this survey, the trust distribution, the most common signals, and the queue of responses waiting for a decision or held back.

Response Quality · review queue

Response quality
Response Quality · review queue

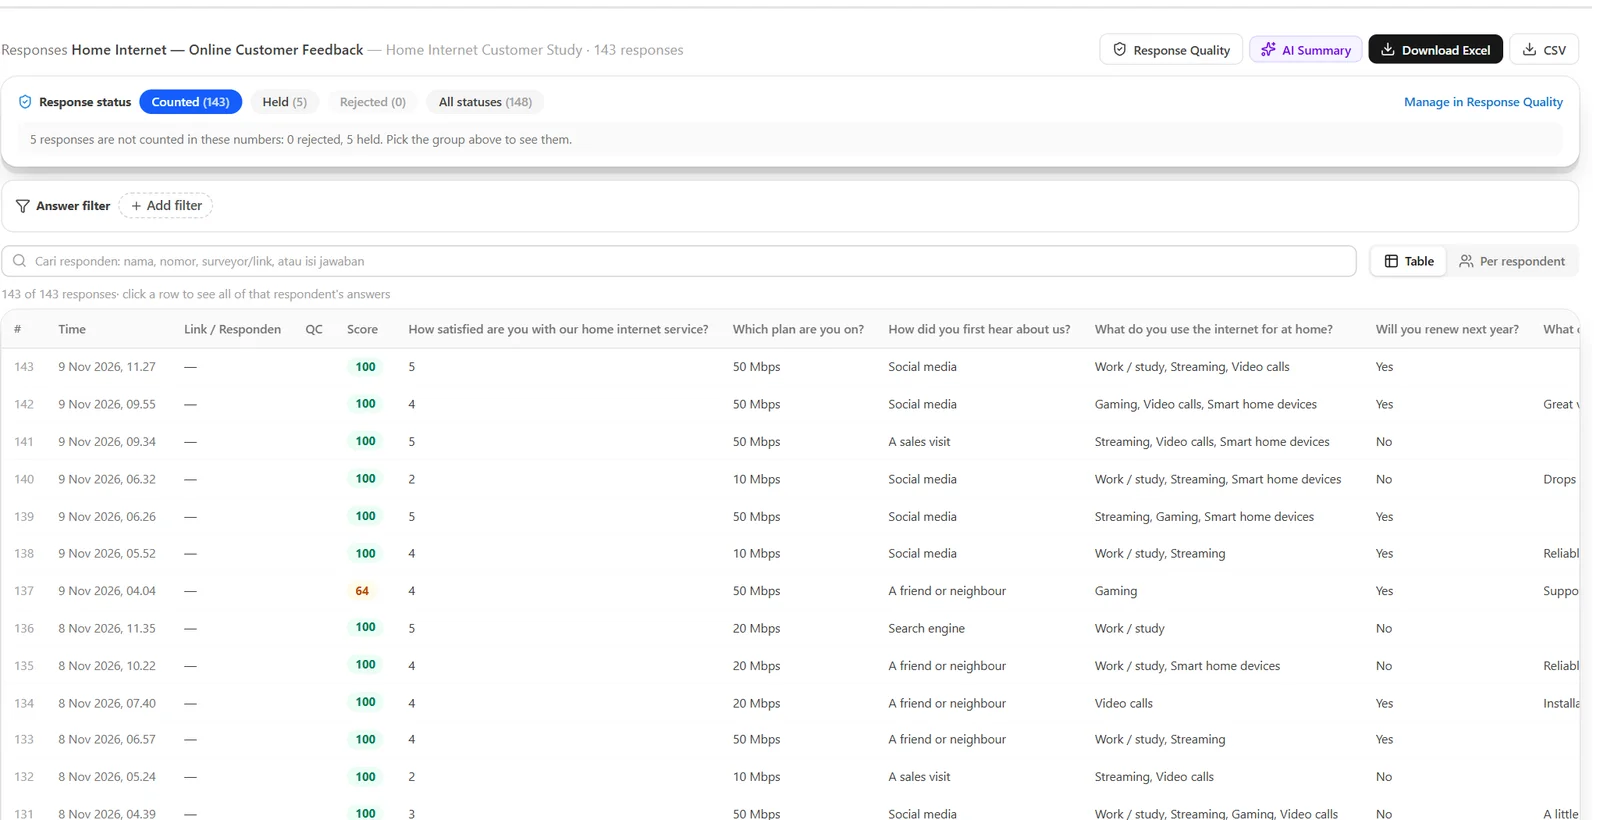
Responses with a score

A trust score next to every answer.

Each row carries its own score; held or rejected responses are not counted in the results, and how many there are is always written above the table.

Responses · score per row

Responses with a score
Responses · score per row

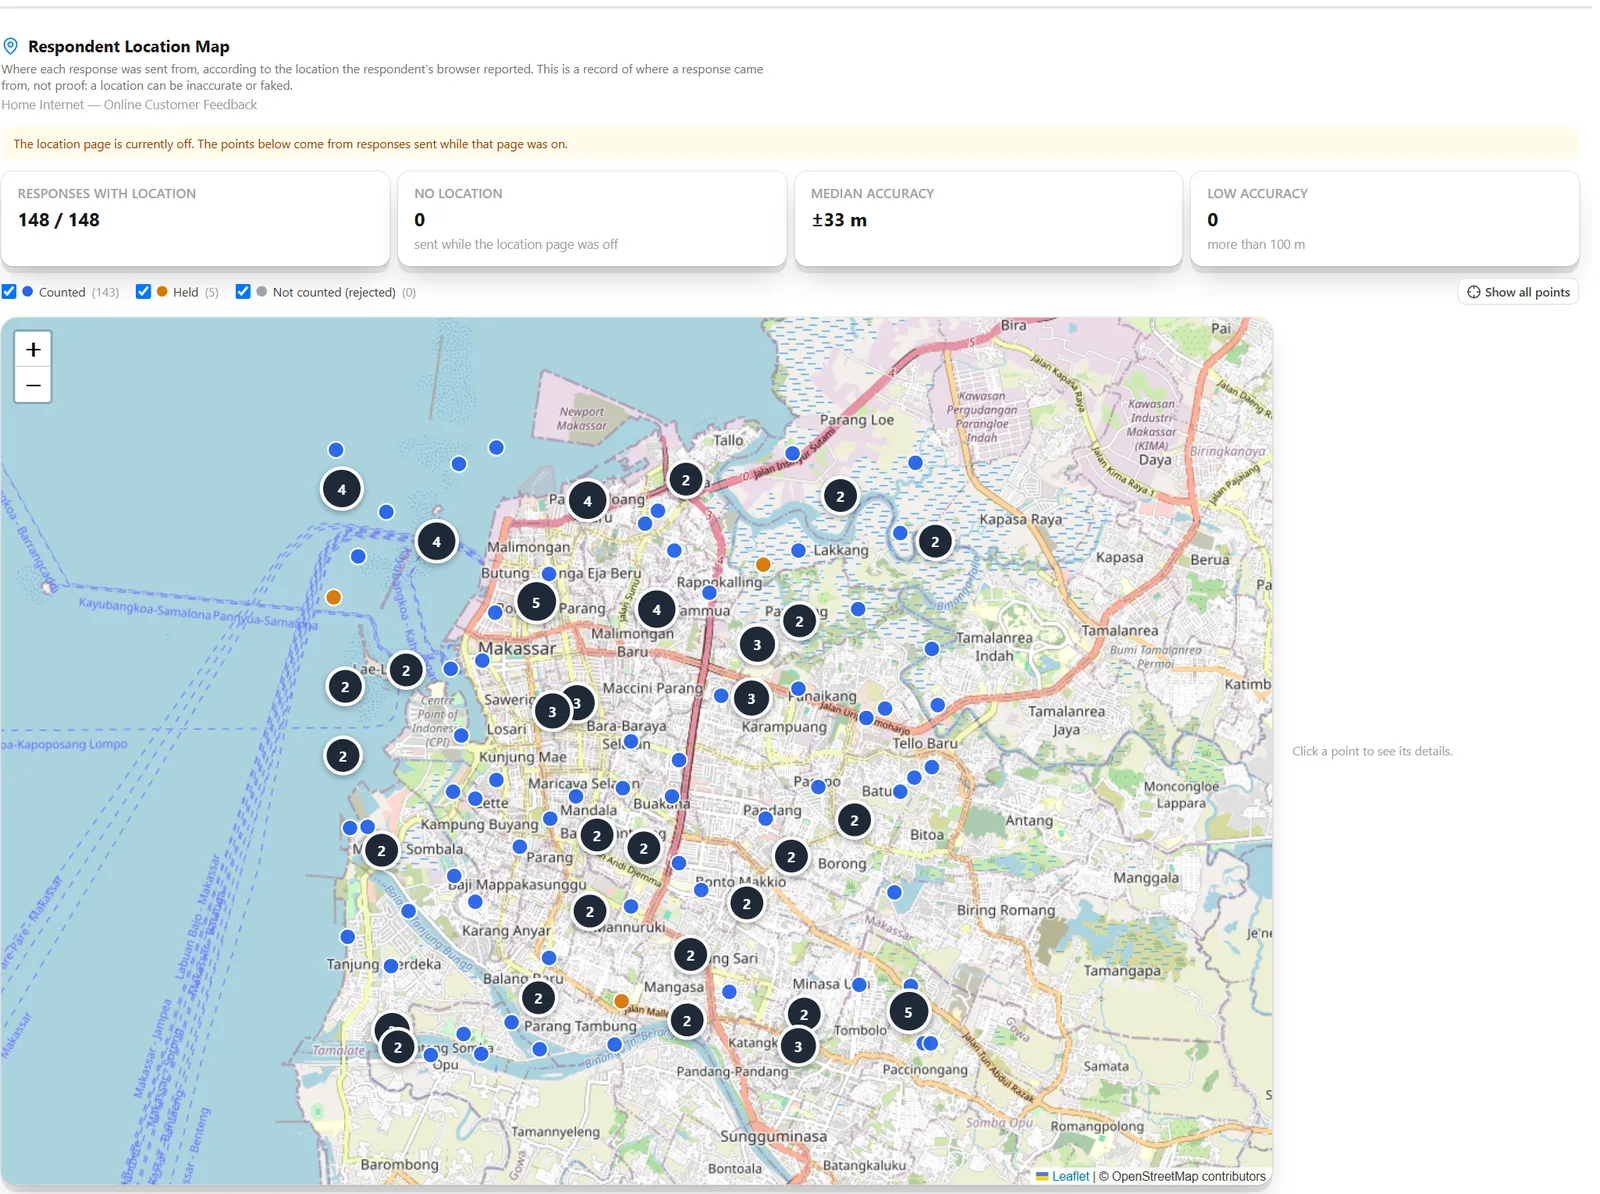
Respondent location map

Where online responses were sent from.

With the location page switched on, the browser's position is stored with the response and drawn on the map with its accuracy. It is a record, not proof: a browser can be wrong or faked.

Location Map · 148 responses

Respondent location map
Location Map · 148 responses
04

Voice Survey

Basic only

Results per question

Every spoken question with the gist of its answers.

Question cards show the AI version of every answer long enough to summarise, one click away from the full transcript.

Results · AI version per answer

Results per question
Results · AI version per answer

All spoken answers

Recordings, transcripts and frequent words.

Every spoken answer in one place with its length, language and transcription status; silent, too-short and hard-to-transcribe answers are flagged.

All spoken answers

All spoken answers
All spoken answers

Checked summaries

An AI gist that says where it came from.

Every gist is written from the transcript, checked back against it, and carries the note that the text and the recording remain the reference.

AI version · with its source note

Checked summaries
AI version · with its source note

Consent & retention

Recording rules set before the survey opens.

Answer language, maximum length, a typing fallback, a microphone check, the consent text and how long audio is kept, from 7 to 730 days.

Voice Survey settings

Consent & retention
Voice Survey settings
+

Across every method

Every tier

Ask your data

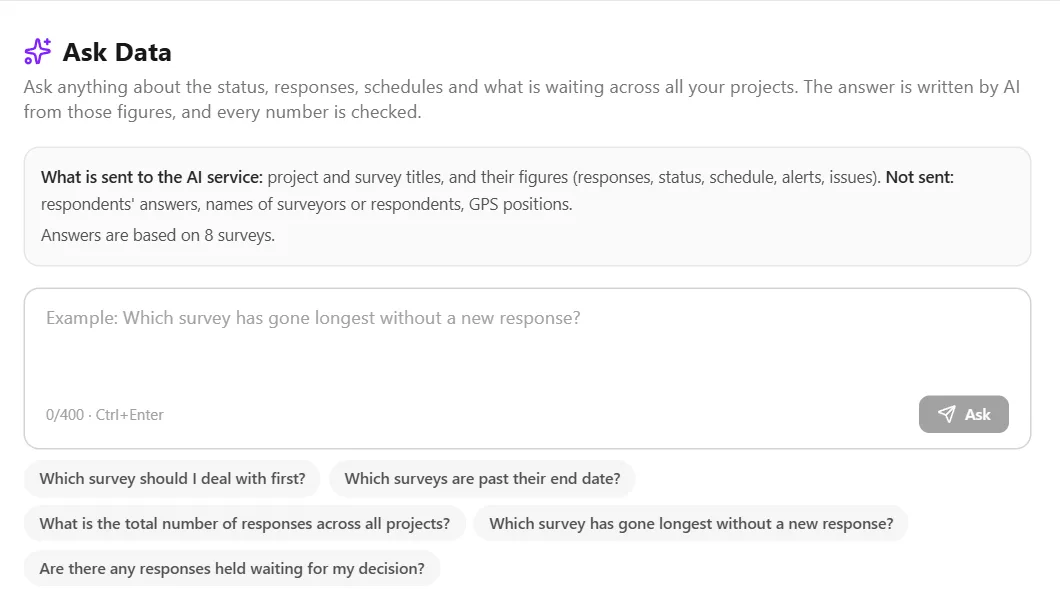
Questions in plain language, across every project.

Ask which survey needs attention first or how many responses are waiting; the answer is written from the platform's own figures and every number is checked. Respondents' answers, names and GPS positions are never sent.

Ask Data

Ask your data
Ask Data

Report Center

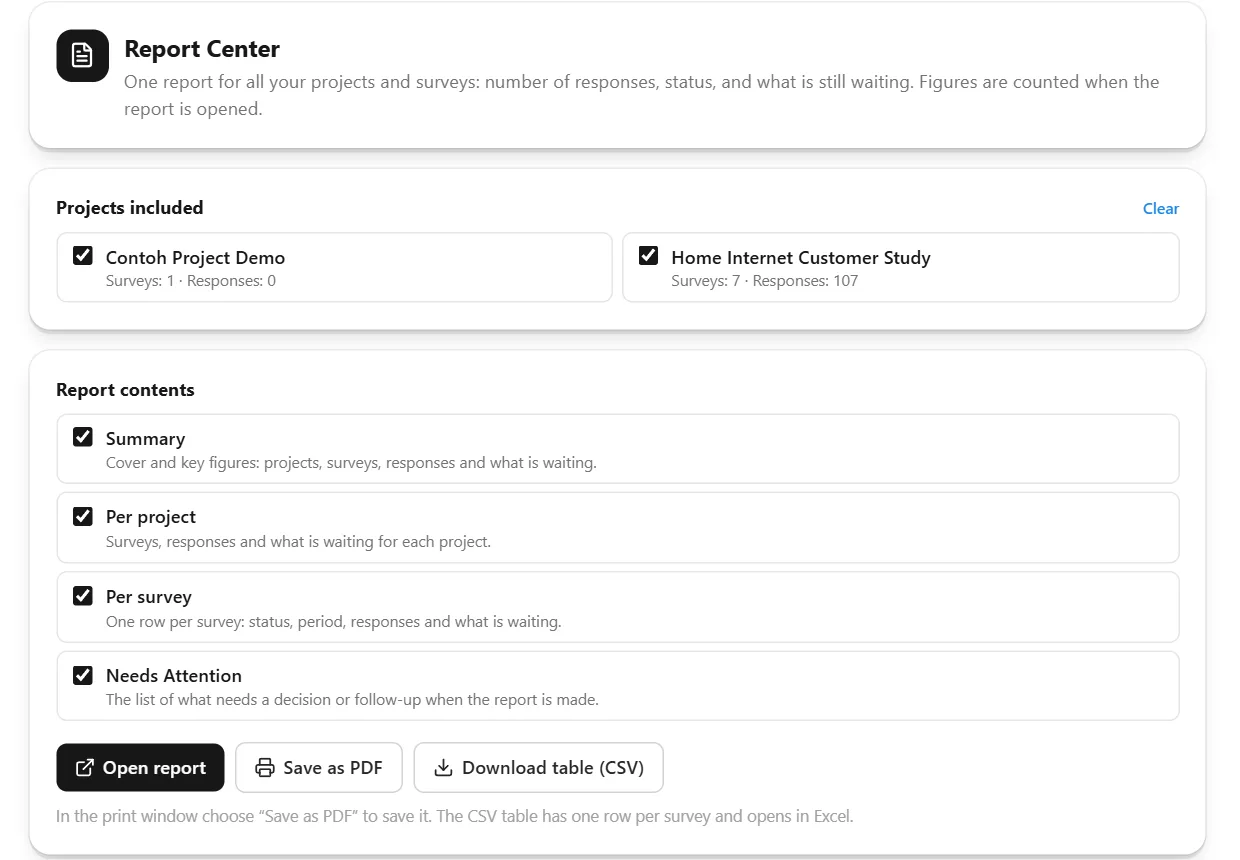
One report for every project.

Pick projects and parts — summary, per project, per survey, needs attention — then open a printable report, save it as PDF or download the table as CSV.

Report Center

Report Center
Report Center

And also

  • A surveyor app that works without signal

    The Study & Research app, in English or Indonesian; interviews queue on the phone and sync when there is signal.

  • AI summary on monitoring pages

    A summary of each results page, with its numbers checked against the data and names masked.

  • Automatic insights

    Fixed rules flag what needs attention: pace against target, groups too small to read, weights not yet run.

  • Timeline

    One Gantt for every project; survey bars come from the collection dates.

  • Alerts and messages

    Alerts, issues and announcements between the office and the surveyors.

  • Sampling engine

    Seven designs, seeded draws, reserves and quotas; invitations exported with personal links.

  • Weighting

    Base weights, nonresponse adjustment, raking and trimming, with the effective sample size.

  • Methodology report

    Written from each survey's configuration; print it or save it as PDF.

  • Exports and API

    Raw data with a codebook, scheduled CSV by e-mail, a REST API and signed webhooks.

  • Audit log

    Owner actions are recorded: who changed what, and when.

  • Roles and access

    Owners, viewers and supervisors per project; surveyors internal or external, with an end date.

  • Two languages

    The whole interface in English or Indonesian; survey content stays as written.

The workflow

From the first plan to the last chart, in one place.

Eight stages, each with its own screens. Basic surveys go through the same stages with fewer decisions; Advanced surveys add the research design.

  1. Stage 01 · Basic · Advanced

    Plan the project

    Create the project, invite the team with their roles, and put every survey on one timeline. Survey bars come straight from the collection dates; phases and milestones can follow a survey. This is also where the tier — Basic or Advanced — and the method are chosen.

    In GatherInsight

    • Projects and roles
    • Timeline (Gantt)
    • Tier and method choice
  2. Stage 02 · Advanced

    Design the study

    State what the study has to estimate, describe the population, choose one of seven sampling designs and upload the frame. The sample size comes from confidence, margin of error, design effect and population size; quotas and reserves are set here. A Basic survey simply picks a template.

    In GatherInsight

    • Study objective and main estimate
    • Population and sampling frame
    • Sample size calculator
    • Quotas and reserves
  3. Stage 03 · Basic · Advanced

    Build the questionnaire

    59 question types in sections and blocks, with logic that skips or shows questions. Welcome, consent, location and confirmation pages, your own colours and type, and a preview that sends test answers without storing them.

    In GatherInsight

    • Question library
    • Logic rules
    • Survey templates
    • Preview
  4. Stage 04 · Basic · Advanced

    Prepare the fieldwork

    Add surveyors — internal or external, with an access end date — split the sample into assignments, draw the areas and set the GPS rule. For phone, write the consent statement and calling hours; for links, choose personal links, access codes or channel links with caps.

    In GatherInsight

    • Assignments
    • GPS rules and areas
    • Call settings
    • Link modes and limits
  5. Stage 05 · Basic · Advanced

    Launch and collect

    Advanced surveys pass a launch check that refuses to start while known problems remain. Then interviews come in from the surveyor app — which keeps working without signal and syncs later — from the Call Console, from the link or by voice; every answer arrives with its evidence.

    In GatherInsight

    • Launch check
    • Surveyor app (offline queue)
    • Call Console
    • Public link and Voice Survey
  6. Stage 06 · Basic · Advanced

    Monitor while it runs

    Live Map and alerts for the team in the field, messages and issues with surveyors, the trust score and review queue, the AI check on recordings, and progress against target by day, by area and by interviewer.

    In GatherInsight

    • Live Map
    • Alerts and messages
    • Response Quality / Quality Review
    • Surveyor Performance
  7. Stage 07 · Advanced

    Clean and weight

    Every doubtful response is approved, sent back or rejected by a person, with the reason recorded. For probability samples the platform computes the weights — base weight, nonresponse adjustment, raking and trimming — and reports the effective sample size.

    In GatherInsight

    • Review decisions
    • Hold mode
    • Weighting
    • Effective n
  8. Stage 08 · Basic · Advanced

    Analyse and report

    Results per question as bar, column, donut, table or trend, compared across groups and periods; AAPOR-style rates; analytics, events and automatic insights; an AI summary whose numbers are checked; the methodology report as PDF; and raw data with a codebook, scheduled CSV or the API.

    In GatherInsight

    • Results & Metrics
    • Analytics, Events, Insights
    • AI summary
    • Reports, exports, API

Two tiers

Basic when you need answers this week. Advanced when the numbers have to stand up.

Every survey starts by choosing its tier. Basic is a quick survey on one link or by phone. Advanced is a full research design: a population, a sample and a team in the field.

Quick surveys & feedback

Basic

Pick a template, write the questions, share one link — or call respondents from the Call Console. No population or sampling to set up.

  • Templates: NPS, CSAT, CES, a free-form survey, or a Voice Survey
  • One shared link, or phone calls recorded after consent
  • 59 question types; welcome, consent, location and confirmation pages; your own look
  • Trust score, too-fast limit and hold mode on every response

Good for: customer feedback, pulse surveys, after-service checks, event feedback

Research with a population and a sample

Advanced

A ten-step wizard takes the study from its objective to launch, with a launch check that refuses to start a survey that still has known problems.

  • 7 sampling designs, with seeded draws that can be reproduced
  • Sample size, margin of error, design effect and weighting
  • Surveyors in the field with GPS rules and a Live Map — or personal links and access codes online
  • A methodology report written from the survey's configuration

Good for: market, academic, household and opinion research

The Advanced wizard

  1. 01Study
  2. 02Population
  3. 03Sampling design
  4. 04Sampling frame
  5. 05Sample
  6. 06Questionnaire
  7. 07Fieldwork
  8. 08Distribution
  9. 09Review & launch
  10. 10Monitor

Which method runs in which tier

MethodBasicAdvanced
01Field survey Not offered

Field interviews need a sample and a team, so they are Advanced only.

Available

Surveyor app, assignments, GPS rules, Live Map, recordings

02Phone survey Available

Call a list from the Call Console; recorded, consent read aloud

Available

Call a drawn sample; outcome per unit, same sampling and weights

03Online link survey Available

One shared link; NPS, CSAT, CES or free-form

Available

Probability or quota designs; personal links, access codes or channel links

04Voice Survey Available

Respondents answer by speaking; transcribed, with an AI gist

Not offered

The Voice Survey is Basic only.

What each tier includes

CapabilityBasicAdvanced
Set-up Minutes: template, questions, link 10-step wizard with a launch check
Ready-made templates (NPS, CSAT, CES, Voice) Available Not offered
Population, sampling frame and 7 sampling designs Not offered Available
Sample size, margin of error, design effect Not offered Available
Weighting (base, nonresponse, raking, trimming) Not offered Available
Personal links and access codes One shared link, with a per-browser limit and an end date Available
Surveyor team, GPS rules, Live Map Not offered Available
Phone interviews in the Call Console Available Available
Respondents answer by voice Available Not offered
Recordings checked answer by answer Phone calls Field and phone
Trust score and review queue Available Available
Results dashboard, AI summary, exports Available Available
Question types 59 59 online and by phone; 13 core types in the surveyor app

Methodology

Built to survive a methodologist's review

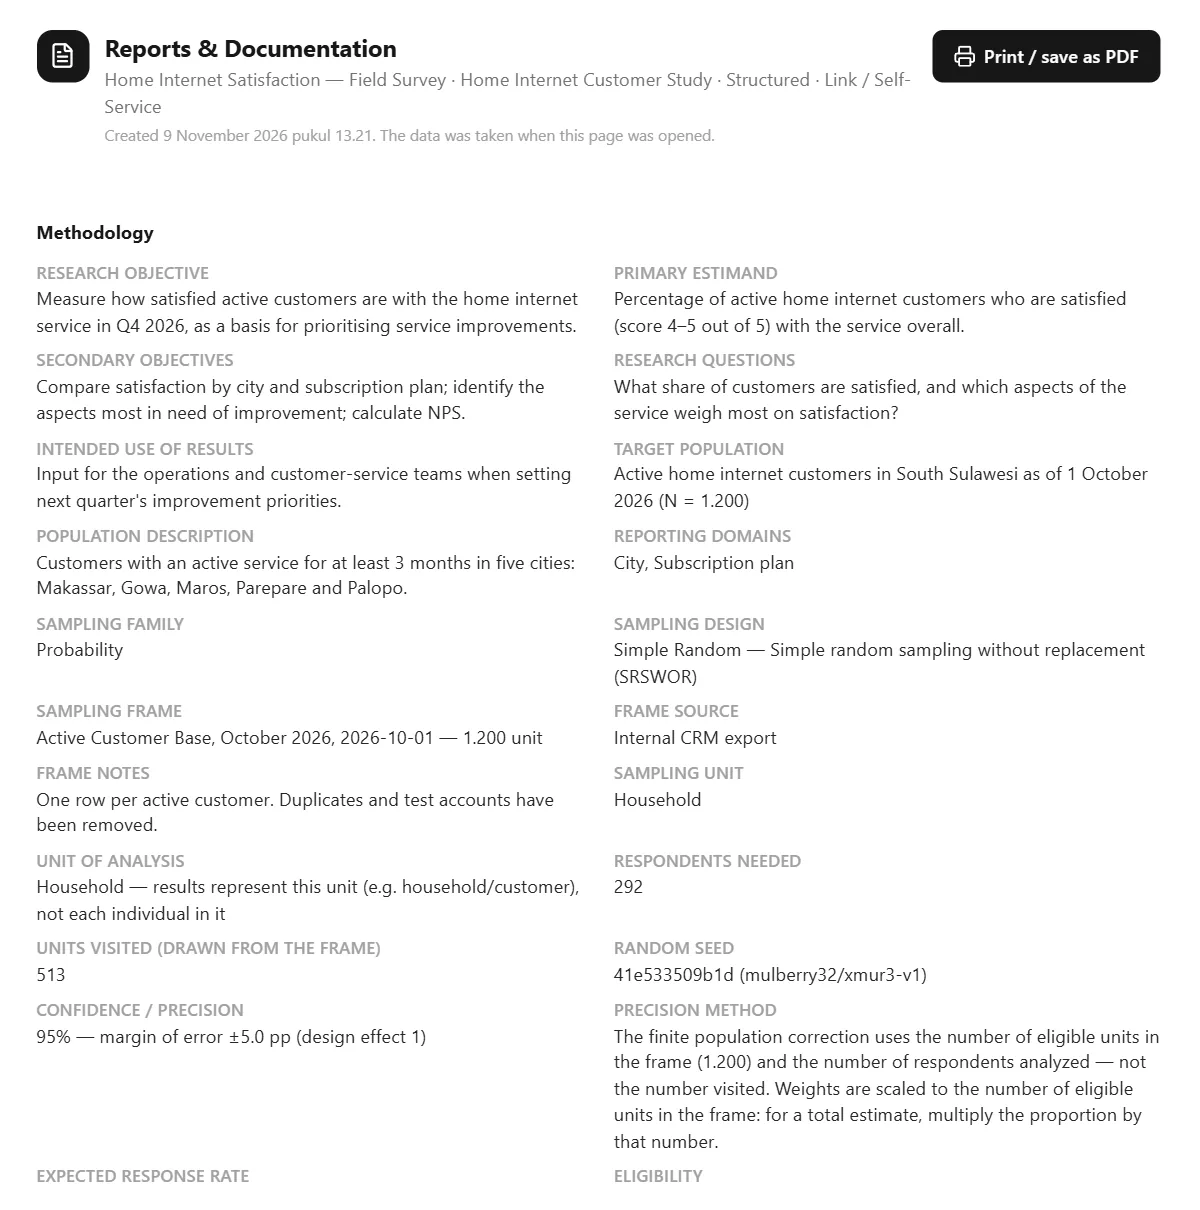
Computed by the platform and written into a methodology report for every survey — not rebuilt by hand in a spreadsheet afterwards.

Sample size and precision
From confidence level, expected proportion and margin of error, adjusted for design effect and a finite population. The realised margin is recomputed from what actually came back.
Seven sampling designs
Simple random, systematic, stratified, cluster, multi-stage, PPS and quota. Every draw stores its random seed, so the selection can be reproduced and audited.
Weights
Base weight 1 / selection probability, optional raking to population shares, and the effective sample size reported so weighting cannot hide a loss of precision.
Response rates
Completion, refusal and eligibility on an AAPOR-style definition, counting unknown eligibility as eligible — the conservative reading.
Methodology
The methodology report of a survey in GatherInsight
Reports & Documentation — the methodology of a live survey, generated on openDemo data

One project, one platform

A survey project usually lives in eight different tools.

With GatherInsight, it lives in one.

The eight tools a project usually needs:

Sample spreadsheetForm builderTeam chat groupMaps appVoice recorderStatistics packageReport slidesShared drive & e-mail
  1. 1 Plan
  2. 2 Design
  3. 3 Questionnaire
  4. 4 Fieldwork
  5. 5 Collection
  6. 6 Monitoring
  7. 7 Cleaning
  8. 8 Analysis & report

From the first plan to the final report: the sample, the questionnaire, the team in the field, the calls, the recordings, the checks and the results. One login, one project, one source of truth. No files changing hands, no numbers copied twice.

A different flow?

If your company works differently, let's build it together.

Every organisation runs its research its own way: other approval steps, other quality rules, other reports, other systems to connect. If your flow is different, or you need something added for your team, let's work together. Hire me onto your team, and I will build it with you.

The standard flow, plus your own steps

PlanFieldworkChecks+ Your approval stepReport+ Your system (CRM / ERP)
  • Fit it to your flow

    Stages, roles, approvals and quality rules set up the way your team already works.

  • Features for your projects

    Question types, checks, dashboards or reports that do not exist yet, built for what you need.

  • Connected to your systems

    A REST API, webhooks and scheduled exports already exist; integrations with your systems can be built on top of them.

  • The person who built it, on your team

    I designed and built GatherInsight from the ground up. I can do the same work for your team.

Contact me

Tell me about your research flow.

Tell me how your team works and what you would like to add. I will reply with how GatherInsight can fit it, and how I can help your team.

N.I.S. Baldanullah

Creator of GatherInsight

Based in
Makassar, Indonesia

Close · Esc